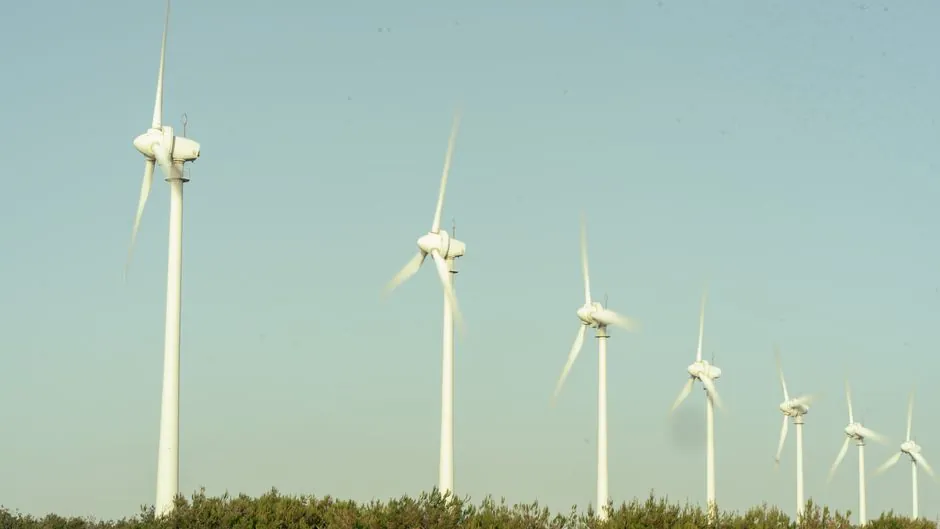
Global wind capacity reached 1,299 GW by year-end 2025, with a record 165 GW added that year and 28,395 turbines installed across 57 countries, per the Global Wind Energy Council's 2026 Global Wind Report [S1].
The wind turbine market is forecast to grow from $194.83 billion in 2026 to $283.8 billion by 2030 at a 9.9% CAGR, with Asia-Pacific the largest and fastest-growing region, driven by net-zero targets, offshore wind investment, and grid-scale renewable integration [S2].
2025 baseline: 165 GW added, Asia absorbs 80%
GWEC's 2026 Global Wind Report places global installed wind power at 1,299 GW by the end of 2025, with 138 countries now generating electricity from wind [S1]. The 165 GW added in 2025 was a 40% year-over-year jump, materially above the 170 GW full-year forecast for 2025 issued by GWEC a year earlier, indicating that installations accelerated faster than the previous outlook [S1][S6].
Asia commissioned 131 GW in 2025, equal to 80% of the global total, with China alone adding more than 120 GW and India nearly doubling its annual installation pace to 6.3 GW [S1]. Europe passed the 300 GW installed-capacity mark, adding 19.1 GW (up 16%), of which the EU-27 contributed 15.1 GW, still below the annual run-rate required for 2030 climate targets [S1]. The US added nearly 7 GW of onshore wind on top of its existing base, supported by the Wood Mackenzie forecast of 48 GW of new US wind capacity through 2030 [S3].
Market value: 2026-2030 sizing across three research houses
The Business Research Company sizes the wind turbine market at $194.83 billion in 2026, up from $178.89 billion in 2025 (8.9% growth), and projects $283.8 billion by 2030 at a 9.9% CAGR [S2]. Mordor Intelligence gives a 2026 value of $186.95 billion with a 10.41% CAGR to $306.79 billion by 2031, a wider horizon that captures the same offshore-led acceleration [S7]. Research and Markets is the conservative outlier: $121.19 billion in 2025 to $157.79 billion in 2030 at 5.42% CAGR, a narrower scope that typically reflects OEM equipment revenue rather than full project value [S5].
The tariff picture matters: imported blades, generators, gearboxes, and electronic control systems have all risen in cost, with offshore and high-capacity units most exposed in Asia-Pacific and North America; the same tariff pressure is pushing localised turbine manufacturing and supply-chain build-out, which lengthens project lead times but is a structural enabler of the 2030 run-rate [S2].
Offshore and high-capacity turbines are the structural growth lever
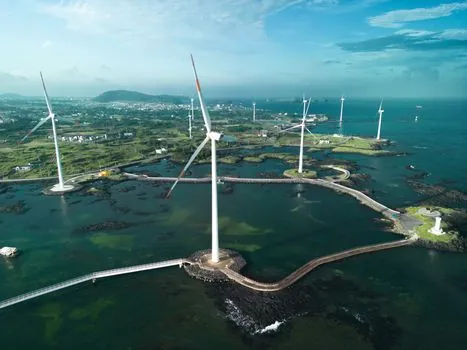
Ultra-high-capacity offshore turbines are transforming next-generation wind projects, with rapid expansion of utility-scale wind farms and increased deployment of offshore installations flagged as the dominant trends through 2030 [S2][S8]. Major trends include advancements in turbine blade materials, integration of digital monitoring systems, and growth of high-capacity wind turbines, all of which feed higher average selling price per MW installed [S2].
The process implications for downstream instrumentation are concrete: a 15 MW offshore unit runs nacelle temperatures above what onshore gearboxes see, demands high-accuracy pressure transmitter feedback on the hydraulic pitch and yaw systems, and uses flow meter monitoring on the cooling and lubrication circuits, all signals that suppliers should plan for higher-mix, higher-spec orders through the decade.
US, Europe, and India: three regional demand engines
Wood Mackenzie projects US wind installations will nearly double by 2026, with the market building towards 48 GW of additions through 2030, supported by US power demand growth averaging around 3% through 2030 versus 0.7% over the previous decade, with data centres named as a meaningful new load [S3]. Europe added 19.1 GW in 2025, with Germany and Türkiye among the largest single-country contributors, and EU-27 capacity at 15.1 GW remains below the pace required to meet 2030 climate targets [S1].
India added a record 6.3 GW in 2025, almost double its prior annual run-rate, and Japan's METI and MLIT completed a second offshore wind tender round in 2023 targeting 1.8 GW across four areas, both policy signals that Asia-Pacific will retain the dominant share of new installations through 2030 [S1][S5]. For context on how the broader industrial automation stack is shifting alongside this build-out, see the SCADA system industry shifts in 2026: cloud, edge, and AI reshape the spec sheet.
What this means for OEMs, suppliers, and EPCs
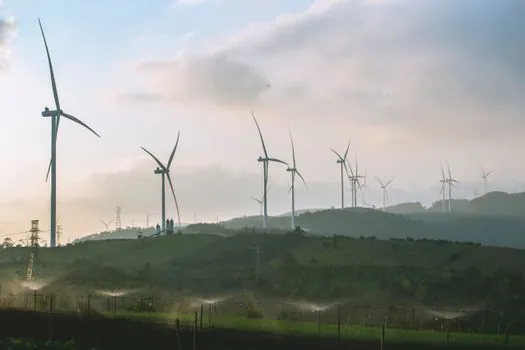
The market is bifurcating between low-cost onshore units serving distributed and emerging-market demand, and a smaller number of very large offshore units where margins and component value concentrate, with rotor blades, gearboxes, generators, and nacelles identified as the four largest component buckets [S2]. For suppliers, the practical spec trend is heavier reliance on digital monitoring, harsher nacelle environments, and stricter grid-code compliance, all of which lift the per-turbine bill of materials for sensors, PLC controls, and industrial valve packages.
The 2025 installation surge of 165 GW already exceeds GWEC's own pre-year forecast of 170 GW (a 170 GW full-year figure with more than 70 GW expected in Q4 alone), which is the strongest empirical evidence that vendor capacity, not demand, is the binding constraint through 2030 [S1][S6]. On the materials side, the offshore build-out is reshaping composites demand, a pattern also visible in the ABS plastic industry 2026: spec-anchored market, grades, and selection map discussion of grade migration.
Limits, risks, and what to track next
GWEC's 2026 report explicitly states that global growth remains uneven and the world is still not on track to triple renewables by 2030, with bureaucratic permitting and slow grid roll-out identified as the binding constraints, not turbine supply [S1]. The EU-27's 15.1 GW in 2025 was up 17% year-over-year but remains below the annual run-rate required for 2030 targets, a gap that depends on permitting reform rather than equipment cost [S1].
Trackable signals over the next 12 months: the GWEC 2027 Global Wind Report release (annual cadence, April 2027) for the 2026 installation total, and the next round of US offshore lease awards and Section 45Y tax-credit guidance, both of which directly shape the 48 GW US pipeline through 2030 [S1][S3]. For suppliers sizing capacity, the most useful benchmark is whether 2026 installations land above or below the 170 GW that GWEC had implied for that year, since that figure anchors every 2027-2030 forecast on the public record [S6].