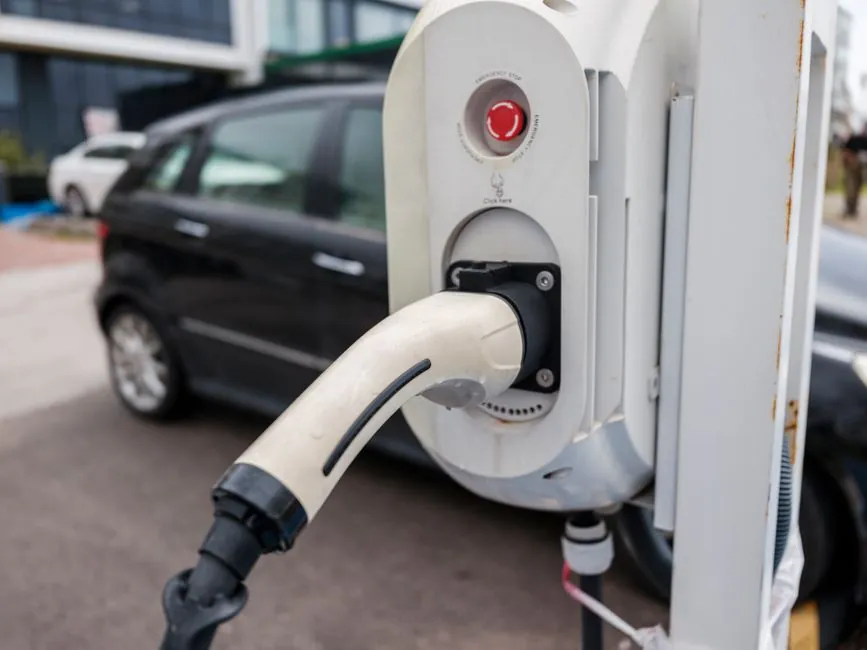
Production capacity planning for an EV charging site resolves to three numbers: how many connectors, what split between fast and slow units, and the kVA the utility must deliver [S3][S4].
Recent peer-reviewed models treat these as a coupled optimization, not three independent decisions, with queuing delay, time-of-use tariffs, and dynamic electricity cost all entering the objective function [S3][S6].
Demand model inputs that drive the kVA number
Site-level planners need four demand inputs before sizing hardware: expected sessions per day, average dwell time, peak-day concurrency factor, and a session-energy assumption in kWh [S2][S4]. The U.S. DOT project planning checklist treats demand estimation and charger-type selection as the first two checklist items, ahead of any electrical scoping [S2].
For a fleet depot, the demand profile is far more concentrated than for retail DC fast charging: a typical duty cycle of 80-100% state-of-charge turnover over a 6-10 hour overnight window, which inverts the design priorities used for highway-corridor sites [S2][S7]. A demand-driven multi-objective model for city-scale capacity allocation, published in 2025, is the first to bind these scenarios into one allocation framework rather than separate siting and sizing steps [S5].
Charger mix: fast vs slow as a capacity variable
Charger type differentiation is treated as a discrete capacity variable, not a marketing choice: a 2025 World Electric Vehicle Journal case study in Changchun's urban core solved to 15 stations carrying 110 fast and 40 slow chargers for a combined 11,544 kVA at an annual system cost of 38.2651 million yuan [S3]. Splitting the mix let the same model cut total system cost 4.31%, investment cost 5.31%, and user cost 3% against a baseline that treated all chargers as one class [S3].
For private fleet planning, the same logic applies inside a single site: slow AC units (typically 7-22 kW) absorb the long-dwell baseline, leaving a smaller pool of DC fast units (50-350 kW) to cover peak arrivals and missed-charge contingencies [S2][S7]. When this mix is ignored and only one charger class is modelled, the 2025 Changchun case shows costs rise and queuing delay worsens in high-demand cells of the network [S3].
Optimization solvers used in 2024-2026 capacity studies
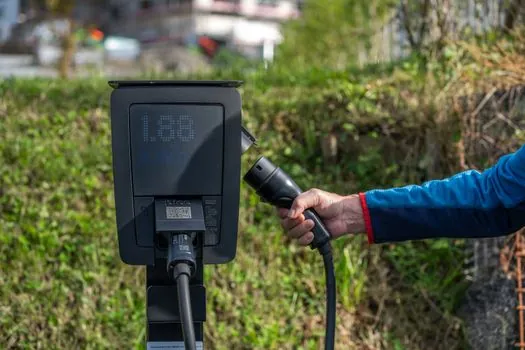
Three heuristic families dominate the 2024-2026 EV capacity-planning literature: genetic algorithm (GA), ant colony optimization (ACO), and simulated annealing (SA), each typically coupled with an M/M/c queueing model for delay estimation [S1][S3]. The 2025 Changchun benchmark found SA beat both GA and ACO on total cost minimization when charger-type differentiation and queuing delay were both active in the objective [S3].
An earlier 2024 review used a genetic algorithm on a p-median formulation for siting, with Arena 14 simulation software validating traffic and charger-count outcomes, and reported that combined location-plus-capacity models minimized both travel distance and waiting time versus siting-only baselines [S1]. A June 2026 preprint extends this further into a collaborative method that solves capacity planning and real-time charging scheduling jointly for multiple stations, which matters once a network crosses roughly 10-15 sites and dispatch between them becomes a real lever [S6].
Queueing and load-profile constraints
Queuing delay is the binding user-experience constraint for public sites, and the queueing model is what separates a serious capacity plan from a count-of-stalls spreadsheet [S3][S6]. The enhanced M/M/c approach used in 2025 captures multi-server behaviour, with arrival rate and service time derived from the demand inputs, while 2026 collaborative work layers a real-time scheduler on top so the same kVA is re-allocated across hours rather than statically reserved per site [S3][S6].
Hardware that already touches these constraints in the field includes AC wallboxes, AC pedestal chargers, and DC fast units; their power electronics, thermal envelope, and protection class are all driven by the power meter and sub-metering chain feeding the site, so any capacity plan must also pin the metering architecture alongside the connector count. Power-quality instrumentation on the AC side (revenue-grade metering, demand monitoring) is a real spec item, not an afterthought, and it is the same class of decision engineers face when picking a pressure transmitter for hazardous-area service: the right instrument depends on the environment, the certification, and the control loop it feeds.
Onsite power capacity: the binding electrical constraint

Onsite power capacity is the third checklist item in the standard U.S. planning workflow, and it routinely forces the design back to the demand model: a 350 kW DC fast unit cannot be added to a site with 200 kVA of utility service without a service upgrade or on-site storage [S2][S7]. Planners therefore size kVA from the demand model first, then confirm the utility can deliver it; if not, the mix shifts toward slower chargers or storage buffers the peak [S2].
For a planning question this is best answered as a three-rule comparison. Rule 1: fast/DC chargers (50-350 kW each) require dedicated utility service or a major upgrade, with low connector-to-session efficiency when dwell times exceed 45 minutes. Rule 2: slow AC units (7-22 kW) ride on existing service in most cases, but require a long dwell window and a higher connector count to absorb the same daily kWh. Rule 3: a mixed site with managed load and on-site storage resolves the peak, at the cost of added balance-of-plant and a more complex metering and industrial valve chain for the thermal and fluid subsystems.
Failure modes and what not to over-spec
The most common failure mode in real capacity plans is not undersizing but ignoring time-of-use tariffs and dynamic electricity cost, which the 2025 Changchun model showed alone can move the objective by several percent even when kVA is fixed [S3]. A second recurring error is treating capacity as a static number; the June 2026 collaborative work argues that a network of more than 10 stations should re-allocate capacity in near real time rather than reserve a fixed kVA per site [S6].
A third failure mode is dual-use overreach: a site that tries to serve light-duty vehicles, farm equipment, and tourist traffic from the same connectors may look efficient on paper, but the demand profiles do not overlap, and utilization falls back to the lowest of the three peaks [S2]. For a deeper siting and electrical scoping workflow, the standard 5-step planning sequence (number of stations, charger type, onsite power, management system, siting) is the most widely cited reference and matches the structure used in both the U.S. DOT checklist and the executive guide format used by major North American charge-point operators [S2][S7][S8].
Standards, siting, and procurement signals

Standards that govern the equipment side of capacity planning include IEC 61851-1 for conductive charging systems, IEC 62196 for plugs and sockets, and SAE J1772 / SAE J3400 for the North American connector interface, with OCPP 2.0.1 as the dominant backend protocol for managed networks [S7]. Siting criteria in the U.S. DOT checklist pull in NEVI Formula Program corridor requirements, ADA accessibility, and utility interconnection timelines, all of which feed back into the demand model because they constrain where kVA can be delivered [S2].
For procurement, the 2026-09-15 verifiable signal is that joint capacity-planning and charging-scheduling optimization has moved from preprint to active research area: a coordinated multi-station method was posted to Preprints on 22 June 2026 and is the most recent peer-trackable update to the joint design workflow [S6]. Track next: the published version of that 2026 preprint, and any 2026-Q4 update to the simulated-annealing-with-queuing benchmark on a second city dataset beyond Changchun [S3][S6].
Background reading: Sand Reclamation Unit: Testing and Commissioning Procedure.