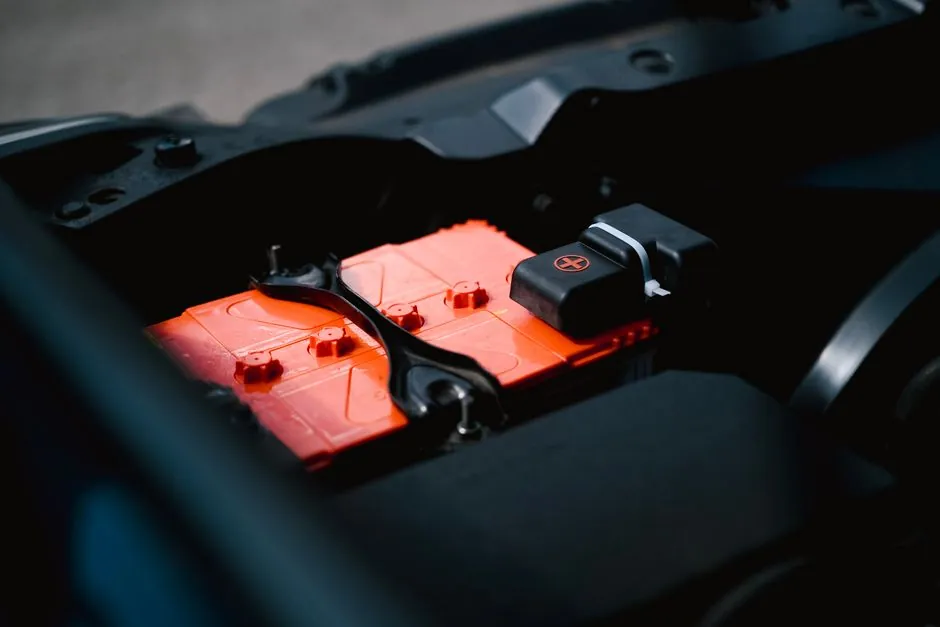
EV manufacturer market share in 2026 is anchored by a Chinese OEM surge, a USD 24.9 billion-to-USD 99.5 billion electric vehicle motor market runway (2022 to 2032, 15.2% CAGR), and a passenger-car mix that has crossed 79% EV registrations in Norway [S3].
Five manufacturers sit on top of the consolidated ranking, with BYD, Tesla, Volkswagen Group, Geely, and SAIC anchoring the leaderboard across BEV and PHEV; the Asian-Pacific region drives the largest volume, Europe trails on policy-driven adoption, and North America remains a smaller share of the global EV installed base [S3][S6].
Manufacturer ranking and 2026 share bands
BYD overtook the global EV maker leaderboard in 2023, holding the largest plug-in share in China and a rising share in Europe and Latin America, on the back of a 2025 push to make smart-driving features standard in mass-market vehicles [S6]. Tesla retains a high share of the global BEV market but lost share to Chinese brands in 2024 to 2025, with Volkswagen Group holding third on the back of the ID. family and joint-venture output in China [S3]. Geely (including Zeekr, Polestar, and Lynk & Co) and SAIC (including MG and the joint ventures with GM and Volkswagen) round out the top five by plug-in volume.
Toyota, Honda, Hyundai, Ford, and Nissan continue to be tracked by analyst breakdowns of the hybrid and electric vehicle mix, although their EV-only share is lower than the Chinese leaders' [S2]. Toyota led global light-vehicle sales in the first half of 2023, with hybrids accounting for a large share of its mix [S4].
What is driving the share shift: motors, transmissions, and policy
EV motor demand is a clean proxy for OEM output: the global EV motor market was valued at USD 24.9 billion in 2022 and is projected to reach USD 99.5 billion by 2032, growing at a 15.2% CAGR from 2023 to 2032 [S3]. Over 3,700 product literature documents, annual reports, and industry statements were reviewed to triangulate the figures, and the supplier base is fragmented across BorgWarner, Continental, Magna, Nidec, Bosch, ABB, Hitachi, Mitsubishi Electric, and Aisin [S3].
The EV transmission market is smaller but high-growth: USD 4.51 billion in 2019, projected to reach USD 20.08 billion by 2027, at a 27.3% CAGR, reflecting the shift from single-speed to multi-speed and dual-motor layouts in higher-torque applications [S5]. Policy levers, including waived import duties and registration tax on EVs in Norway, drove 79% of new passenger car registrations to be electric in 2022, while Poland's 2020 subsidy covered 15% of the EV purchase price [S3].
BEV vs PHEV vs HEV: criteria-based comparison
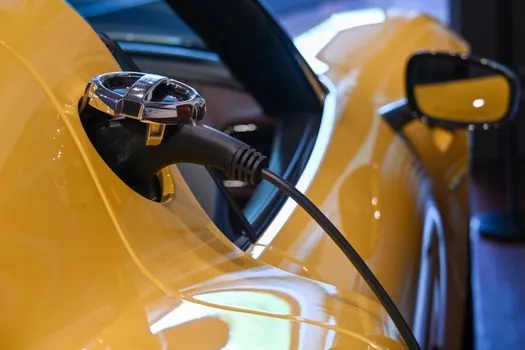
Battery Electric Vehicles (BEVs) have zero tailpipe emissions and rely entirely on the battery pack, with motor suppliers including BorgWarner, Continental, Magna, Nidec, Bosch, ABB, Hitachi, Mitsubishi Electric, and Aisin competing on power density and cost [S3]. Plug-in Hybrid Electric Vehicles (PHEVs) pair a smaller battery with an ICE and are graded on all-electric range, with regulatory tailwinds from Euro VI emission limits (NOx below 0.4 g/kWh) and the EU 130 g/km CO2 fleet target that drove the original HEV adoption wave [S2]. Hybrid Electric Vehicles (HEVs) do not plug in; they recover energy through regenerative braking and use the motor to assist the ICE, with Toyota, Hyundai, Honda, Ford, and Nissan being the most cited manufacturers [S2].
The decision is largely application-driven: short-commute urban buyers gravitate to BEVs for operating cost, fleet operators pick PHEVs when range anxiety is a blocker, and HEVs remain the choice for markets without strong charging infrastructure or subsidies [S1][S2]. Marine, AUV, and commercial vessels pull a parallel set of battery and hybrid electric drivetrains from Torqeedo, Corvus Energy, Electrovaya, Saft, and Duffy Electric Boat, where the same BEV/HEV/PHEV split applies but on a 5-year CAGR basis [S1].
Regional share map: APAC dominates, Europe leads on policy
Asia-Pacific is the largest revenue contributor to both the HEV and EV motor markets, driven by Chinese OEM scale, the Chinese government's top-tier focus on autonomous vehicle development, and the rapid infrastructure build-out in China and India [S2][S3]. Europe is second by volume, with Norway's 79% EV share in 2022 acting as the high-water mark for the EU policy mix of CO2 fleet limits, import duty waivers, and registration tax breaks [S3]. North America (US, Canada, Mexico) is third, with state-level incentives offsetting the absence of a federal mandate similar to the EU CO2 framework.
Emerging markets in South America (Brazil, Argentina, Colombia) and the Middle East and Africa (Saudi Arabia, UAE, Egypt, Nigeria, South Africa) are tracked as the next demand pool for both marine and passenger EVs, with HEV penetration cited as below average in developing markets and identified as the upside segment by analyst outlook [S1][S2][S7].
Limitations, failure modes, and what to watch
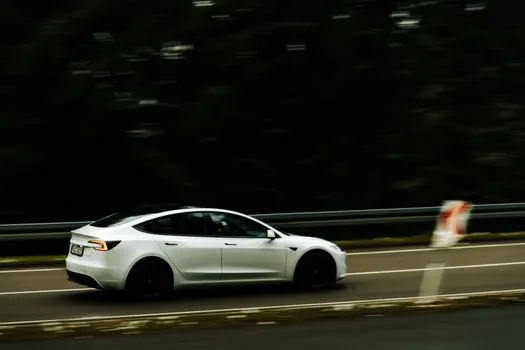
High manufacturing cost is identified as the main headwind for the EV motor market through 2032, with raw material exposure to neodymium, copper, and grain-oriented electrical steel cited as the dominant cost driver; readers evaluating motor spec gates should consult the silicon steel selection map for automotive e-motors for the loss, gauge, and grade decisions that sit behind the cost line. The high-performance EV subsegment adds battery energy density requirements, with Li-ion chemistries dominant and the 2026 mix tilting toward LFP for mass-market packs and NMC for premium ranges [S9].
Hybrid and EV fuses remain a documented failure-mode point: voltage ratings differ by application (12V, 48V, 400V, 800V architectures), and a fuse mismatch is one of the most common warranty returns in early-model EVs [S10]. Marine EVs add a third dimension, with battery ingress protection and underwater AUV housings requiring vendor-specific qualification beyond the passenger-car standards [S1]. A further limit is consumer preference uncertainty: longitudinal discrete choice experiments show EV preferences develop in a non-monotonic pattern over a six-year window, complicating long-horizon volume forecasts [S8].
Sourcing map: motor, transmission, fuse, and battery suppliers
The EV motor supplier base is highly fragmented, with no single vendor holding a dominant share; the named players include BorgWarner Inc., Continental AG, Magna International Inc., Nidec Corporation, Robert Bosch GmbH, ABB Ltd, Hitachi Ltd., Mitsubishi Electric Corporation, and Aisin Corporation [S3]. Strategies across this set include product launches, contracts, expansions, and agreements, with the report scope covering 14 countries and regional segment analysis in USD million for the 2023 to 2032 window [S3].
EV transmission specialists are partially overlapping with the motor list, with single-speed and dual-motor architectures dominating the 4.51 billion USD 2019 base that grows to 20.08 billion USD by 2027 at 27.3% CAGR [S5]. Fuse and battery-propulsion-system suppliers feed the same OEMs, with marine, hybrid, and battery-electric fuses drawn from a mix of specialist and tier-1 electrical houses [S7][S10]. Standards guiding this sourcing map are emissions-led (Euro VI 0.4 g/kWh NOx, EU 130 g/km CO2 fleet), safety-led (UN R100 for high-voltage EV systems, ISO 6469 series, IEC 61851 for charging), and classification-led (marine type approval from IACS members, L-class for small craft) [S2].
Trackable signals for the next planning cycle: BYD's progress on standardising smart-driving features across mass-market trims (announced as a competitive moat in 2025), the 14-country EV motor market dataset being updated through 2032, and the 27.3% CAGR EV transmission market print on the 2019 to 2027 horizon [S3][S5][S6]. The European CO2 fleet tightening post-2026 and the next revision of Euro VI are the most concrete regulatory events to monitor alongside the Chinese OEM export push into Latin America and Southeast Asia [S2][S3].
Spec-level background on the components involved: electric actuator, electric ball valve, and electric pallet truck.