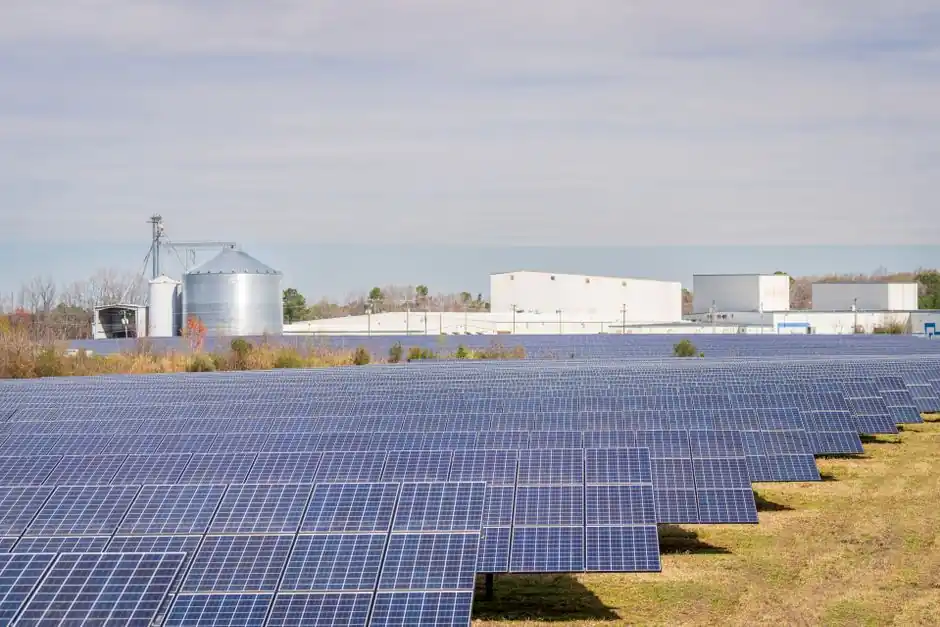
Floating solar (FPV) capacity is on a steep growth track in 2026, with the global market valued at USD 11.23 billion in 2026 and forecast to reach USD 86.51 billion by 2035 at a compound annual growth rate (CAGR) of 25.86% [S3]. The 5 MW to 50 MW capacity band currently captures the largest share of new FPV deployments, with on-grid connectivity dominating project architectures [S3].
Floating solar sits inside a much larger solar build-out: 510 GW of solar capacity was added worldwide in the most recent reporting year, with solar alone accounting for nearly three-quarters of all renewable additions [S8]. The IEA expects solar PV generation to overtake wind and nuclear globally in 2026 and hydropower by 2029 [S7], so any capex move into FPV is taking share from a fast-growing pie rather than a flat one.
2026 market sizing: how big the floating PV segment really is
Precedence Research values the global floating solar market at USD 11.23 billion in 2026, growing to USD 86.51 billion by 2035 at a 25.86% CAGR [S3]. A separate forecast from DataM Intelligence pegs the narrower floating solar panels segment at USD 61.49 million in 2025, projected to USD 323.20 million by 2033 at a 23.0% CAGR [S4]. The two figures are not directly comparable: the larger number covers full FPV systems, balance-of-plant and EPC scope, while the smaller one isolates the panel module line item, which is why the per-watt ratio looks very different between the two reports.
Fortune Business Insights projects the broader solar floating panel market at USD 78.34 billion in 2026, rising to USD 421.37 billion by 2034 at a 23.4% CAGR [S5]. For process engineers sizing inverters, servo-motor string trackers and SCADA tie-ins, the relevant figure is project-level capex, not module-only spend, so the USD 11.23 billion 2026 baseline from [S3] is the most useful anchor for FPV-specific planning.
Regional split: Asia-Pacific leads, North America accelerates
Asia-Pacific dominated the global FPV market in 2025 with a 49% share, with stationary floating panels, 5 MW to 50 MW project size, and on-grid configurations the dominant sub-segments [S3]. DataM's panel-only view puts Asia-Pacific at 34.9% share in 2025 but growing fastest at 23.0% CAGR through 2033, led by China, Japan, and India deploying on reservoirs, mining lakes, and hydro-linked water bodies [S4].
North America held approximately 37.4% of panel-level FPV share in 2025 per [S4], with growth shaped by utility-scale renewable mandates, water-conservation needs in drought-prone U.S. states, and interest in co-located generation on reservoirs and wastewater treatment plants. Precedence flags North America as the fastest-growing regional CAGR across the 2026 to 2035 window [S3], a notable divergence from the panel-only DataM series that has Asia-Pacific growing fastest [S4].
Europe is strengthening via environmental compliance frameworks and optimization of artificial water bodies such as hydroelectric reservoirs, quarry lakes, and industrial ponds, but permitting complexity and aquatic ecosystem impact assessments are still slowing large-scale rollouts compared with Asia-Pacific [S4].
Drivers: water-stress economics, bifacial gain, AI-assisted O&M

Water-body reflectance and the water-cooling effect on module temperature are the core physical advantages cited for FPV over ground-mount. The cooling effect of the water body and its inherent reflective properties increase the effective output of floating panels versus equivalent land-based arrays, with the secondary benefit of reducing reservoir evaporation [S3]. DataM further notes that technology evolution is moving beyond basic pontoon systems toward high-durability floating platforms, corrosion-resistant anchoring, and bifacial module integration, with water-reflected irradiance lifting yield per square meter [S4].
Artificial intelligence is reshaping FPV economics in 2026: AI-driven monitoring continuously analyzes sensor data on the floating platform to identify inefficiencies and predict equipment wear, reducing downtime and improving O&M economics [S3]. On the broader PV plant, flow-meter and pressure-transmitter telemetry on cooling water loops is now standard input for these models, which means FPV sites are typically instrumented at parity with conventional utility-scale solar.
Land scarcity is the structural demand driver. Floating solar avoids reclaiming agricultural or greenfield land, instead using rivers, lakes, ponds, and reservoirs that have no alternative productive use for power generation, and the cost is broadly equivalent to land-based plants at utility scale [S3]. The India, Southeast Asia, Middle East, and U.S. Southwest cluster of water-stressed, high-demand regions is where pipelines are growing fastest [S4].
How FPV compares with ground-mount and offshore PV
FPV versus ground-mount PV versus offshore PV on the four criteria that drive most 2026 EPC decisions:
Land use: FPV is the strongest, sitting on existing water bodies with only small cabinet footprints; ground-mount needs 5 to 10 acres per MW depending on panel tilt; offshore PV is not yet a commercial reference class in 2026 [S3][S4].
Module cooling and energy yield: FPV gains a water-cooling boost and bifacial reflectance gain over ground-mount; offshore PV (where deployed) has lower cell temperatures still but higher soiling and salt-spray derating; ground-mount is the baseline [S3][S4].
Capex and project lead time: FPV sits at parity with ground-mount in cost but with higher marine-grade component and anchoring complexity; offshore PV is the highest capex and longest lead time; ground-mount is the fastest to commission. DataM specifically calls out anchoring complexity, storm resilience requirements, and supply chain constraints in marine-grade components as the schedule risk for FPV [S4].
Permitting and environmental review: ground-mount is fastest; FPV faces aquatic-ecosystem and evaporation-impact reviews that slow large-scale rollout in Europe and parts of North America; offshore PV is the most permit-heavy and is in early commercial deployment only [S4].
Pipeline context: utility-scale PV dwarfs FPV, but tax credit safe-harbor flows help
The U.S. solar industry installed 11.4 GWdc of capacity in Q2 2026 alone, a 45% increase year-over-year, with utility-scale driving the rebound at 9.6 GWdc, up 61% year-over-year [S2]. The July 2026 safe-harbor deadline has passed, cementing a 216 GWdc to 240 GWdc pipeline that supports installations through 2030, with developers that missed the deadline now facing a December 31, 2027 placed-in-service cliff [S2].
For 2026 specifically, U.S. utility-scale solar is on pace for 43.4 GW planned, a 60% increase over 2025 installations, and solar plus storage are projected to lead 86 GW of total new U.S. capacity in 2026 [S10]. EIA's January 2025 STEO forecast 22 GW of U.S. solar additions in 2026, on top of 26 GW added in 2025 [S1], and SEIA's mid-2026 outlook still reflects an approximate doubling of the U.S. solar fleet over the next five years [S2].
On the global supply side, solar PV is now the strongest-growing generation source, with the IEA expecting it to overtake wind and nuclear by 2026 and hydropower by 2029 [S7], against a record 510 GW of solar added worldwide in the prior year [S8]. Within that, FPV is still a small but compounding slice: even at a 25.86% CAGR, the 2026 to 2035 doubling pattern looks more like a niche share-gain story than a primary capacity story. SEIA flags that Section 232 action on polysilicon (August 2026) and the FCC's July 28, 2026 addition of foreign-produced inverters to its Covered List will reshape domestic solar supply chain economics, a knock-on risk for FPV project costs that import Asian modules or inverters [S2].
Constraints and failure modes specific to FPV
Project developers and EPCs should weigh four hard constraints before committing to FPV. First, anchoring complexity: marine-grade anchoring systems are still a supply-chain pinch point, with limited qualified vendors outside Asia-Pacific [S4]. Second, storm resilience: floating platforms need to survive category-level wind and wave events, which constrains siting on open water relative to sheltered reservoirs [S4]. Third, long-term maintenance uncertainty: many regions remain in demonstration or early utility-stage adoption, so O&M cost curves are not yet as well-characterized as for ground-mount [S4]. Fourth, permitting: environmental impact assessments on aquatic ecosystems are the main reason European FPV rollouts lag Asia-Pacific [S4].
For instrumentation and control scope, FPV sites are typically built around the same SCADA architecture as utility-scale ground-mount: string-level monitoring, DC combiner monitoring, industrial-valve-controlled cooling loops where hydro-FPV hybrids are deployed, and weather stations for soiling and irradiance correction. The Global Solar Council reports total connected solar capacity reached 2.7 GW by the end of May 2026 in a representative regional sample, an increase of almost 300% since 2023 [S6], a baseline that FPV project developers should benchmark their own pipeline growth against.
2026 sourcing and standards to track

There is no single international standard for FPV-specific design in 2026, so EPCs typically combine ground-mount PV standards (IEC 61215, IEC 61730 for modules, IEC 62446 for documentation) with marine and dam-safety standards for the floating structure and anchoring. On the U.S. side, the safe-harbor rules under IRC Sections 48E and 45Y, plus Treasury's February 2026 interim guidance (Notice 2026-15) on Foreign Entity of Concern and Prohibited Foreign Entity definitions, are the binding tax-credit and supply-chain constraints that any 2026 FPV project must model [S2]. FEOC material-assistance thresholds step up in 2027, so developers trying to begin construction in 2026 need to lock their supply chain now [S2].
Two further 2026 dates worth flagging: Treasury must publish additional safe-harbor tables by December 31, 2026, and the December 31, 2027 placed-in-service cliff applies to projects that missed the July 4, 2026 begin-construction deadline [S2]. Watch the Q4 2026 SEIA Solar Market Insight update and the next IRENA renewable capacity statistics release for hard FPV-specific capacity additions, since the 2026 figures cited above are still mostly projections rather than installed-base counts.
For a U.S.
For related coverage, see Epoxy anchor install cost vs wedge anchor: 2026 price breakdown.