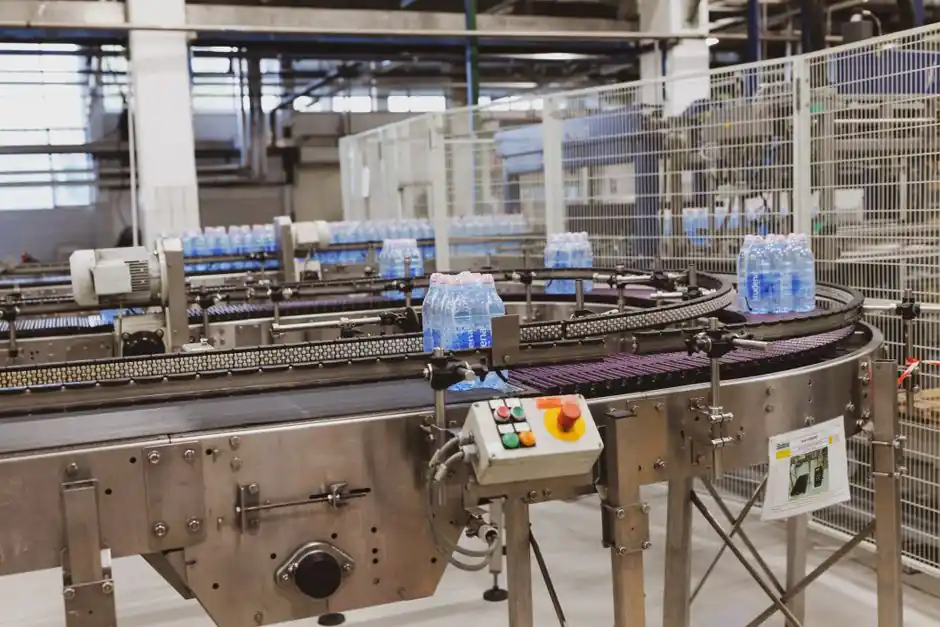
The global food processing equipment market is valued at USD 60.35 billion in 2026, on track to USD 87.82 billion by 2035 at a 4.27% CAGR, per Precedence Research [S1]. The wider processing-and-handling envelope sits much higher: USD 132.7 billion in 2026 growing to USD 200.9 billion by 2033 at a 6.1% CAGR, per Persistence Market Research [S2]. Mordor Intelligence pegs the food processing machinery subset at USD 88.21 billion in 2026, climbing to USD 116.18 billion by 2031 at 5.67% CAGR [S3]. The spread between figures (60B vs 88B vs 132B) reflects scope, not contradiction: Mordor and Persistence include packaging and handling, while Precedence narrows to core processing conversion equipment.
Asia Pacific dominates demand, holding 36% of 2025 revenue in the Precedence scope and 38.21% in the Mordor scope, and is forecast to post the fastest regional CAGR at 5.33% through 2031 [S1][S3]. Persistence expects the region to outrun all others at 7.4% CAGR through 2033, anchored on capacity build-out in China, India, and Southeast Asia [S2]. For process engineers, this matters because most new greenfield lines for snack, dairy, beverage, and ready-meal applications now ship into APAC first, with North American and European capacity upgrades running on a replacement and FSMA-compliance cycle rather than expansion [S2].
Three Report Scopes Side by Side: Processing, Machinery, and Handling
The three leading 2026 market reports do not contradict each other; they measure different concentric rings, and buyers should pick the scope that matches their spec sheet. Mordor Intelligence reports processing equipment led its food processing machinery market with 53.92% share in 2025 and advances at 5.04% CAGR through 2031 [S3]. Persistence breaks the wider processing-and-handling market into three product rings: Food Processing Equipment at 52.8% of 2026 revenue, Food Packaging Equipment (the fastest-growing product ring at 6.7% CAGR to 2033), and Food Service & Handling Equipment [S2]. Maximize Market Research gives food processing equipment a 48% slice of its 2025 processing-and-handling total, with bakery and confectionery applications holding 28.5% of revenue [S4].
On a like-for-like scope, Precedence (USD 60.35B in 2026) is the most conservative; Mordor (USD 88.21B) and Maximize (USD 122.40B in 2025 base) cover progressively broader machinery and handling rings, and Persistence (USD 132.7B) is the widest at processing + packaging + service handling [S1][S2][S3][S4]. The relevance for a process engineer doing capex justification is that the CAGR differentials (4.27% vs 5.67% vs 6.05% vs 6.1%) translate directly into depreciation horizon assumptions, and the slowest CAGR applies to the narrowest scope where primary transformation equipment dominates. Equipment tied to powder handling, coating, and size reduction is a separate slice tracked at USD 15.8B in 2025 with a 6.4% CAGR to USD 24.5B by 2032, growing faster than the headline food processing number because it cross-serves pharmaceuticals, battery materials, and 3D printing powders [S5].
Automation Tiers: Manual, Semi-Automatic, Automatic, and Smart/AI-Enabled
Semi-automatic lines still anchor installed base, holding 46.73% of 2025 revenue in the Mordor machinery scope, while smart and AI-enabled systems are the fastest-growing automation tier at 7.24% CAGR through 2031 [S3]. Persistence sees the automatic tier holding 54.8% of 2026 revenue in the wider processing-and-handling scope, with semi-automatic expanding at 5.2% CAGR as small and mid-sized food processors buy cost-effective productivity upgrades [S2]. Precedence flags the automatic segment as the mode-of-operation leader in 2025 within its narrower processing scope [S1]. The four-tier picture from the 2026 reports: manual is the legacy floor (FSMA-driven decommissioning pressure in North America), semi-automatic is the volume tier, automatic is the standard for new APAC greenfield lines, and smart/AI-enabled is the capex premium tier.
Smart/AI-enabled lines earn their premium through three measurable returns: real-time defect detection that cuts giveaway and recall risk, predictive maintenance that reduces unplanned downtime on continuous lines (cookers, extruders, retorts), and energy/resource optimization that hits utility OPEX directly [S1][S3]. Strategic Market Research's 2026 powder processing report frames this as a structural shift: "Equipment must now support traceability, hygiene, and contamination-free processing. This pushes manufacturers toward automated and enclosed systems rather than manual or semi-automated setups" [S5]. For a U.S. or EU plant upgrading under FSMA, the practical decision is rarely manual vs. automatic, it is semi-automatic vs. smart/AI-enabled on the same footprint, where the delta in capex is typically 15–30% with a payback window of 24–48 months on lines running above 60% OEE.
Application Mix: Bakery Leads, Beverages Large, Meat/Poultry Steady, Fruits & Vegetables Fastest
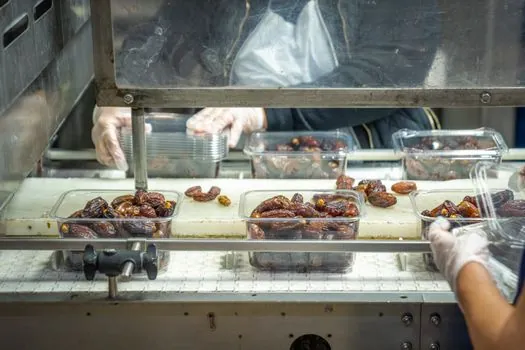
Bakery and confectionery is the largest application segment in 2025 across two of the three reports, with Mordor putting it at 27.12% of 2025 revenue and Maximize at 28.5% [S3][S4]. Beverages hold 19.3% of the wider 2026 processing-and-handling market per Persistence, making it the single largest application ring on that broader scope [S2]. Meat, poultry, and seafood is the dominant application in Precedence's 2025 processing scope, reflecting North American protein-processing installed base [S1]. Mordor expects meat, seafood, and meat-alternative processing to expand fastest at 6.12% CAGR through 2031, while Persistence projects fruits and vegetables as the fastest-growing application at 7.1% CAGR to 2033 [S2][S3].
The decision matrix for application selection is straightforward on a four-criterion compare: bakery (28% share, low capex per line, low regulatory friction, short lead times), beverages (19% share, high hygienic design bar, stainless 304/316L standard, medium lead time), meat/poultry/seafood (largest in NA, USDA-FSIS / FSMA compliance bar, longer commissioning, mid lead time), and fruits & vegetables (fastest CAGR, seasonal throughput swings, wash/grade/cool heavy, variable lead time) [S1][S2][S3][S4]. Related reading on packaging-line vendor maps at the 2026 cut-off is covered in this 2026 packaging machinery vendor map. Powder handling for ingredient-intensive lines (cocoa, milk powder, spice blends, protein isolates) is its own sub-market tracked at USD 15.8B in 2025 with 6.4% CAGR [S5].
Regional Sourcing Reality: APAC Build, EU/NA Compliance Retrofit
Asia Pacific is both the largest revenue region (36–38% in 2025) and the fastest-growing through 2031–2033 across all three 2026 reports [S1][S2][S3]. Europe held 20% of the Maximize 2025 processing-and-handling market, with North America close behind, but neither region matches APAC's expansion rate [S4]. North America's 5.4% CAGR to 2033 is essentially a compliance-and-replacement cycle: FSMA-driven hygienic design upgrades, traceability retrofits, and line-level automation [S2]. A 2025 Indian government sanction of 536 food processing units under the PMSKY scheme is a direct procurement signal: that volume hits the order books of European and Chinese equipment makers serving the dairy, fruit-processing, and grain-handling segments [S4].
The nearshoring incentive layer in the U.S. and EU is reshaping supplier geography, with Mexico and Eastern Europe absorbing redirected capex from APAC-sourced lines for U.S. and EU end-markets, a driver Mordor sizes at +0.5% on CAGR [S3]. For a sourcing decision, the practical sequence is: confirm regulatory driver (FSMA for U.S., EU Regulation 853/2004 for EU, FSSAI for India, GB 14881 for China), then map the equipment scope to the regional supplier base, then stress-test lead time. For continuous-process lines (extrusion, retort, aseptic fill), APAC lead times are typically 6–9 months ex-works, while European and North American suppliers run 4–7 months at a 10–25% cost premium. The throughput economics on a snack or beverage line almost always favor APAC-supplied equipment when end-market geography is global; for FSMA-bound domestic supply, U.S./EU suppliers retain the documentation advantage. Side-stream equipment on the same plant floor (gear drives, couplings) carries its own selection logic, covered in this gear coupling selection map for food processing drives.
Vendor Map and Competitive Intensity

The supplier base stays fragmented and competitive intensity stays moderate in 2026 across all three top-line reports, which is the structural reason smart-line technology disruptors keep winning share against legacy OEMs [S3]. Mordor reports a fragmented supplier base, which means plant engineers should treat equipment selection as a specification exercise (hygienic design, CIP/SIP capability, IO-Link or OPC UA on the control side) rather than a brand-loyalty exercise [S3]. Persistence frames the competitive landscape as one where manufacturers "increasingly invest in energy-efficient, IoT-enabled processing lines to meet regulatory compliance and reduce operational waste" [S2]. The 2026 strategic read: the leading OEMs (GEA, Marel, JBT, Bühler, Tetra Pak, SPX, Alfa Laval, Heat and Control, Hosokawa) hold installed-base advantage, but the smart/AI-enabled tier is being populated by specialist disruptors with vision-based QC, IIoT-native PLC stacks, and modular skid designs.
On a 2,000 ft view, the vendor map by equipment scope reads: bulk material handling (Bühler, GEA, Hosokawa), powder processing (Hosokawa, GEA, Bühler, Tetra Pak for dairy powders), meat/poultry/seafood (Marel, JBT, Baader, GEA), dairy and beverage (GEA, Tetra Pak, SPX, Alfa Laval), bakery/snack (Heat and Control, GEA, Reading Bakery Systems, Bühler), and packaging downstream (ProMach, Tetra Pak, Syntegon, Krones) [S2][S3][S5]. For capex, the cross-cutting OEM differentiators in 2026 are hygienic design certifications (3-A, EHEDG), CIP/SIP cycle time, IIoT data model openness (OPC UA vs proprietary), and energy-per-ton throughput on continuous lines. Buyers running global plants should expect 10–20% capex premium for IIoT-native lines but a measurable OEE lift in the first 12 months. For the broader 2026 industrial capex picture (drives, controls, sensors), this spec-anchored selection guide on inductive sensors is a useful adjacent read on sensor spec discipline that applies equally to food line position feedback.
Sub-Markets: Hot Food Processing and Powder Processing
Two sub-segments of the food processing equipment market carry their own 2026 forecasts worth tracking separately. The hot food processing equipment market sits at USD 27.64 billion in 2026, projected to USD 34.89 billion by 2030 at 6% CAGR, per Research and Markets [S6]. This scope covers cookers, blanchers, pasteurizers, retorts, fryers, and heat-exchanger skids, the thermal-processing core of any ready-meal, soup, sauce, or protein-cook line. The growth premium over the headline 4.27% CAGR reflects demand for high-pressure processing (HPP), ohmic heating, and continuous-flow thermal systems that cut hold time and energy per kilogram [S1][S6]. Powder processing equipment sits at USD 15.8B in 2025, climbing to USD 24.5B by 2032 at 6.4% CAGR, mixing/blending equipment alone accounting for 28–32% of 2025 revenue [S5].
The decision crossover between hot-food thermal and powder-handling equipment matters on dairy, cocoa, and protein-fortified lines, where the same plant can carry both. A U.S. ready-meals market at USD 63.3B with 9.1% CAGR cited by Mordor pulls upstream demand for both thermal and powder-handling lines because ready-meal formulations increasingly include protein isolates, sauce powders, and seasoning blends [S3]. For plant engineers, the practical implication is to size powder-receiving and dosing upstream of the thermal block, not as a downstream afterthought, since hold-up volume and CIP coverage on the powder side drive line availability more than thermal block capacity on most cook-and-chill flows. Strategic Market Research's 2026 framing applies directly: "Industries are no longer dealing with basic bulk powders. They are working with engineered materials, specialty chemicals, nutraceutical blends, and additive manufacturing powders. That changes everything, from precision requirements to contamination control" [S5].
Selection Criteria and Trackable 2026 Signals
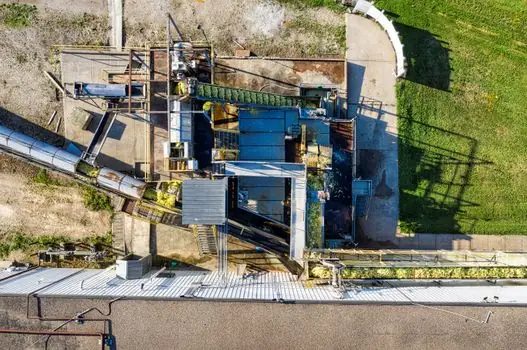
For a 2026 capex decision on a food processing line, the criteria cut is: scope (processing-only vs processing-and-handling, 60B vs 132B), automation tier (semi-automatic 46.73% share vs smart/AI-enabled 7.24% CAGR), region (APAC 36–38% share at 5.33–7.4% CAGR vs NA 5.4% CAGR), application (bakery 27–28% vs meat/seafood 6.12% CAGR vs fruits/vegetables 7.1% CAGR), and hygienic compliance (3-A, EHEDG, FSMA, EU 853/2004) [S1][S2][S3][S4]. Trackable signals for the next reporting cycle: (a) whether the smart/AI-enabled CAGR above 7% holds once 2027 capex data lands, since vendor counts in that tier are still small; (b) whether APAC's 7.4% CAGR in the Persistence scope compresses as Chinese domestic OEMs (Bright, Triowin, Angel Yeast equipment lines) capture more share; and (c) whether the 2025 Indian PMSKY 536-unit sanction translates into 2026–2027 order intake at the European and Chinese OEMs that won those contracts [S2][S4]. The 2026 reports converge on one structural read: food processing equipment remains a moderate-CAGR, fragmented, regionally skewed market where specification discipline, not brand loyalty, wins capex.
Component reference pages worth checking: ndt equipment, anti static equipment, and construction machinery and equipment.