
An LCR meter derives impedance by forcing a known AC test current (or voltage) through the device under test, digitising the resulting voltage (or current) vector, and dividing the two phasors to get Z. The real and imaginary parts of that complex number, R and X, are then combined with the test frequency to back out L, C, R, D, Q, ESR, and theta [S1][S2].
In practice the instrument is a narrowband vector voltmeter plus a sine source: a typical bench unit sweeps 20 Hz to 2 MHz at 1 V or 100 mV drive levels, while a handheld tops out at 100 kHz; accuracy ranges from 0.01 to 0.1% on the bench side to 0.1 to 0.5% in the field [S4][S2]. The two most common internal implementations are the auto-balancing bridge and the AC ratio-arm bridge, both of which reduce to the same phasor equation once the bridge null is reached.
The Phasor Equation at the Core: Z = V / I
An LCR meter does not measure L, C, or R directly. It measures the magnitude and phase of the voltage across the DUT relative to the current driven through it, then computes the complex ratio Z = V / I, written as Z = R + jX where R is the resistive (in-phase) component and X is the reactive (quadrature) component [S1][S5]. With a known test frequency f, reactance is split: XL = 2*pi*f*L for an inductor, and XC = 1 / (2*pi*f*C) for a capacitor, and the sign of X tells the meter which one is dominant [S2][S3].
The phase angle theta between V and I is the diagnostic that separates R from X. A pure resistor reads 0 degrees, an ideal capacitor reads -90 degrees, and an ideal inductor reads +90 degrees; any real component lands somewhere on that arc, and the LCR meter's job is to place the DUT on that arc with the smallest possible error [S4][S3]. From theta and |Z| the meter recovers R = |Z|*cos(theta) and X = |Z|*sin(theta), which is why a 4-wire Kelvin connection matters even at audio frequencies: lead resistance and lead inductance would otherwise contaminate the very R and X being measured [S8].
Why "AC Bridge" Still Means Bridge: Auto-Balancing vs Ratio-Arm Topologies
Despite the digital name, the heart of most LCR meters is still a bridge circuit driven to its null. In the auto-balancing bridge, the DUT forms one arm and a range resistor forms the other; a feedback loop adjusts the inverting input of an op-amp until the current through the DUT is exactly balanced by the current through the range resistor, and the magnitude and phase of the balancing voltage are the meter's V/I readout [S7]. In the AC ratio-arm bridge (the classical Wien/Schering/transformer ratio topology), the DUT is ratioed against calibrated transformer windings at a known reference, and the null is detected with a phase-sensitive detector at the test frequency [S7].
Both topologies share two engineering facts. First, the source is a sine, not a square, because harmonic content would excite the DUT at frequencies other than the test f and corrupt X. Impedance analyzers go further: instead of a single nulling detector, they sweep a wide frequency range and fit a user-defined equivalent-circuit model (Rs-Ls, Cp-D, Cp-G, Lp-Q, etc.) to the recovered Z data, which is how they extract parameters like ESR or DC bias dependence that a single-frequency LCR meter only hints at [S6].
Calibration That Makes the Math Trustworthy: Open, Short, Load
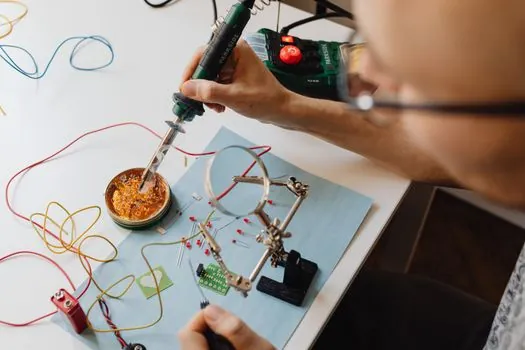
Raw V/I from a bridge is not the impedance of the DUT, it is the impedance of the DUT plus the test fixture, plus the lead parasitics, plus the residual of the range resistor. The standard correction sequence is open/short/load: the meter measures its fixture with nothing connected (capturing stray admittance Y_open), with a low-inductance shorting bar (capturing Z_short), and optionally against a known reference load. Subsequent DUT readings are then corrected as Z_dut = (Z_meas - Z_short) / (1 - Y_open * (Z_meas - Z_short)) [S3][S8]. This is why short, clean Kelvin leads and a real warm-up period are not optional, especially for sub-ohm ESR or sub-pF capacitance, where a few milliohms of lead resistance or a few hundred femtofarads of lead capacitance is a significant fraction of the reading.
Drive level matters just as much. Likewise, a 1 V drive on a small-signal inductor can push it toward saturation and read a lower L than the DC-bias-free data sheet [S2][S4].
Derived Parameters: D, Q, ESR, and the Series/Parallel Choice
Once R, X, and f are known, the LCR meter computes the secondary parameters the way the industry has standardised them. Dissipation factor D = R_s / X_s = 1/Q is the tangent of the loss angle; for a capacitor it is normally reported with a parallel model, for an inductor with a series model. Quality factor Q = X_s / R_s = 1/D. Equivalent series resistance ESR is the R_s read at the test frequency, and it is the figure that matters for capacitor ripple heating in a switching power supply [S2][S8]. The phase angle theta = arctan(X / R) completes the standard set, and most meters report it alongside the primary reading [S1][S3].
Series versus parallel is not a free preference, it is a physical fact about the DUT. A small-value, low-loss component (a 1 nF NP0 cap, a 1 mH air-core coil) is best modelled as a series R-L or R-C because the parasitic is mostly resistive in series with the ideal element. A large-value, high-leakage component (a 100 uF electrolytic, a ferrite bead at low frequency) is best modelled as a parallel R-C or R-L because the leakage path is across the element. The same DUT measured in the wrong model will give the wrong L or C, but the same Z and the same theta, which is why a careful engineer watches the D value (below 0.1 to 0.2, pick series; above, pick parallel) rather than trusting the meter's default [S3][S4].
Selection Criteria: Handheld, Bench, or Impedance Analyzer
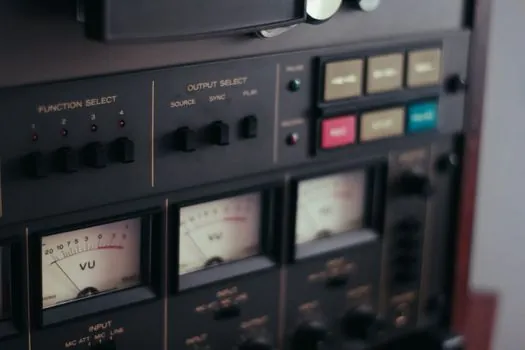
The right tool depends on what you need from the measurement. A handheld LCR meter covers 100 Hz to 100 kHz at 0.1 to 0.5% accuracy, runs on batteries, and costs in the budget-to-mid range, which is the right fit for field service, incoming inspection spot checks, and sorting unmarked parts [S4]. A bench LCR meter covers 20 Hz to 2 MHz or wider, drops accuracy to 0.01 to 0.1%, and adds features like DC bias, list sweep, and binning, which is the right fit for design validation, production QC, and any measurement where the data sheet tolerance is tighter than 1% [S2][S4]. An impedance analyzer adds swept frequency, equivalent-circuit fitting, and DC-bias characterisation on top of the same bridge hardware, and is the right fit when the parameter you actually need (ESR versus frequency, inductance under DC bias, dielectric dispersion) cannot be captured at a single spot frequency [S6].
Pick the tool by three questions. What frequency band does the component see in the real circuit? What is the worst-case tolerance the spec demands? And what is the secondary parameter you need, D, Q, ESR, or theta? If the answer to the first is inside 100 kHz and the answer to the second is looser than 0.5%, a handheld will do. If you need sub-0.1% or any band above 100 kHz, or you need to characterise a part's behaviour rather than its value, step up to a bench or an analyzer [S2][S4]. The single most common engineering mistake is using a DMM with an LCR mode for capacitor or inductor selection: DMM LCR modes are fixed near 1 kHz with 1 to 5% accuracy, and they cannot tell a good 100 uF electrolytic from a dried-out one at the switching frequency that matters [S4].
Limits, Failure Modes, and Common Reading Traps
Bridge nulls fail, and when they do the reading is wrong in characteristic ways. Below about 1 ohm, lead resistance and the range-resistor tolerance dominate, so a measurement of "ESR = 50 milliohm" on a clip-lead setup is usually lead resistance, not the part. Above about 1 megohm, fixture leakage and the input impedance of the detector dominate, so a reading of "leakage resistance = 500 megohm" is usually the meter's limit, not the part [S3][S8]. At very low capacitance (sub-pF) or very high inductance (henries), the residual impedance of the fixture, not the DUT, is the largest term in the Z = V/I equation, which is why production fixtures are guarded and why short/open calibration at the fixture, not the meter terminals, is the only way to get repeatable data [S8].
Drift is the slow failure mode. Dielectric absorption, capacitor soakage, and inductor temperature rise all shift the reading over seconds to minutes. Most bench LCR meters specify a warm-up of 30 to 60 minutes before the unit holds its rated 0.01% accuracy, and most MLCC and electrolytic parts need 5 to 10 seconds of settling at each new frequency before the meter converges [S2][S4]. The final trap is mistaking the displayed primary for the parameter of interest: a meter showing "C = 100.3 uF, D = 0.082" at 1 kHz is not telling you what the same part will do at 100 kHz, in a 3.3 V bias, or in a 2 A switching loop. The bridge gives you Z at one f, one drive level, one DC bias; the engineer has to decide whether that point is the right one for the decision at hand [S2][S6].
Standards, Sourcing, and What "Traceable" Buys You
Calibrated LCR meters at the bench or production line are usually traceable to national standards through a defined artefact set: precision air capacitors, wire-wound standard resistors, and standard inductors. For an LCR reading to be defensible in a supplier audit or a customer datasheet claim, the meter needs a recent cal cert, the fixture needs an open/short/load trace, and the test conditions (f, V_drive, V_bias, integration time) need to be recorded alongside the number [S3][S8]. The relevant international references for the bridge method itself are IEC 60216 for the capacitor and inductor environmental envelope, and manufacturer-specific application notes that document the equivalent-circuit models (series vs parallel, Rs-Ls vs Cp-D, Lp-Q) the meter uses when it converts R, X, f into the secondary parameters.
For a related reference on how phase-locked vector measurement is used in another sensor chain, see IEPE charge amplifier two-wire operation. For a deeper look at the geometric metrology side of fixture and probe alignment, vision measuring machine camera-based readout covers the same four-wire contact-discipline mindset. The LCR meter's basic measurement function, including how R, X, and theta map onto capacitance, inductance, and resistance, is documented in the LCR meter fundamentals entry; adjacent electrical-measurement theory lives in the electrical measurement reference.
For component inspection, the same open/short calibration discipline that makes an LCR reading trustworthy is the basis of the flow measurement and AC motor test setups in production, and the bridge nulling concept is the same one used in VFD input impedance characterisation. The overhead bridge crane reference covers a different kind of bridge, but the engineering instinct is the same: balance two arms, read the null, and trust the calibration.