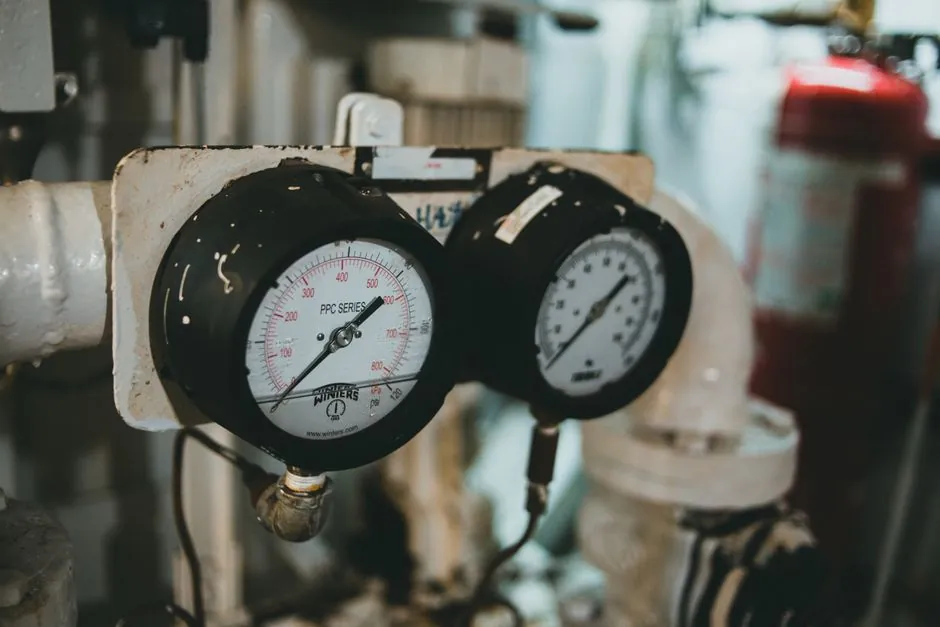
For procurement teams sizing a hydraulic power unit for presses, conveyors, balers, mobile plant, or injection moulding, whole-life cost modelling (acquisition, install, operate, maintain, dispose) is the only method that produces a defensible line item, and the wider UK procurement guidance cited in 2026 frames TCO as the sum of purchase, operating, replacement, and upgrade costs across the asset life cycle [S1].
What TCO actually includes for an HPU
A hydraulic power unit lifecycle cost model breaks the bill into eight live lines: purchase and installation, electric power consumption, hydraulic fluid top-up and oil analysis, filter changes, planned and unplanned downtime, preventative maintenance labour, component repair, and reservoir/condition degradation over time, per a February 2026 UK power-pack lifecycle guide [S2].
The standard TCO formula used in 2026 industry literature is TCO = I (acquisition + install) + O (operating) + M (maintenance) + D (downtime, scrap, disposal) [S7]. For an HPU on a 2-shift, 4,000 h/year duty, energy alone has been observed to exceed 5-10x the purchase price across the asset's life, and filter changes run 3-6 per year on contaminated industrial sites [S2].
UK fleet-finance guidance, applied to industrial assets, treats TCO as the financial basis for budgeting, asset-lifecycle management, vendor selection, and lease-vs-buy decisions; the same framework fits HPUs because replacement and upgrade costs at end of life are rarely negligible on multi-decade plant [S5].
Cost drivers ranked by impact
Roughly 60-80% of lifetime HPU cost on a continuously running industrial duty sits in energy and fluid; on intermittent mobile or standby duties the dominant line shifts to downtime and repair, per a 2026 UK TCO breakdown [S1].
The five levers that move the bill the most: pump selection (gear vs piston vs servo), filtration class, reservoir sizing, motor/drive topology (fixed speed vs variable-speed servo), and cooling/heat-rejection design, per a February 2026 component-level breakdown [S2]. A wrong-size pump is the classic failure mode: oversized wastes energy, undersized overheats, and both shorten seal and bearing life.
Fluid-leak economics, often forgotten, are quantified: at a Hydraulic Fluid Index of 4.1 and 200 US gal (about 760 L) tank, a continuously running HPU accrues 800 gal (about 3,030 L) of oil replenishment annually (around $33,600 at $42/gal) plus about $16,000 of used-oil disposal, while a sealed alternative actuator shows $0 on both lines (cost basis April 2022) [S4]. That is the single largest non-energy line item on many legacy HPUs.
Energy and variable-speed drive economics
A variable-speed controller paired with a water-cooled synchronous servo motor can save up to 60% of energy versus a fixed-speed conventional unit on the same duty, with a synchronous motor footprint up to 80% smaller than a comparable asynchronous motor, per a 2021 OEM reference design for sub-30 kW units [S3].
Side benefits: a 3D-printed sand-core manifold block up to 40% smaller with reduced pressure losses, an active dewatering stage, and a CFD-optimised reservoir that drops oil volume from 600 L to 150 L (about 75% smaller), directly trimming fill and disposal cost [S3]. On a 30 HP (about 22 kW) HPU running continuously at $0.17/kWh, modelled annual energy cost is around $16,429 versus $1,642 for a sealed power-on-demand alternative (70% efficient vs 22% efficient), an annual delta of about $14,800 (cost basis April 2022) [S4].
The FRL unit on the HPU's downstream side is the second energy hotspot; pressure regulators set above load demand waste flow as heat through the relief valve, so right-sizing regulator setting and adding a load-sense circuit is one of the cheapest TCO moves available on legacy packs.
Filtration, fluid, and reservoir: the contamination chain
About 80% of unplanned machine downtime on hydraulic systems is caused by contaminated lubricants, per a 2022 industry figure that 2026 guides continue to cite as a working rule of thumb [S4]. Cheap filters cut acquisition cost, clog faster, push differential pressure up, and shed media into the oil, accelerating pump and valve wear [S2].
Reservoir design sets fluid life: undersized tanks cut dwell time, run hot, generate varnish and sludge, and shorten fluid-change intervals from a typical 1-2 years down to 6-9 months in heavy service [S2]. A degassing unit sized to the return-line flow keeps dissolved air below 2% by volume, which protects pumps from cavitation and reduces aeration-driven oil-temperature spikes.
Oil top-up on continuously running presses typically runs 1-2 years between change-outs; on mobile or outdoor plant exposed to water ingress and dust, expect the 1-year end of that range and budget accordingly. Filter changes typically 3-6 per year, scaled to dust load and ISO 4406 target cleanliness code [S2].
Fixed-speed vs variable-speed vs power-on-demand: a side-by-side

The three main topologies compared on four decision criteria (energy use, fluid and leak exposure, condition-monitoring readiness, fit-for-duty): [S2]
(1) Fixed-speed, fixed-displacement gear or vane pump: lowest purchase, highest operating cost. Typical efficiency 22% on continuously running industrial duties. Best on simple intermittent mobile applications where holding pressure without active control is acceptable [S4].
(2) Variable-speed servo with synchronous motor: mid-to-high purchase, 60% energy saving possible versus (1) on matched duty, footprint up to 80% smaller, embedded sensors for control pressure, oil level, temperature, filter Δp, and optional water-content and particle counters, ready for Industry 4.0 retrofit [S3]. Best on continuous or cyclic industrial duty from 5-30 kW.
(3) Sealed power-on-demand electro-hydraulic actuator: highest purchase per kW, near-zero fluid and disposal cost, minimal maintenance labour, sealed against leaks so scrap and downtime risk fall toward zero; energy draw only when motion is demanded [S4]. Best where leak-free, low-maintenance, and low total fluid volume are the deciding factors.
Connectivity, condition monitoring, and the data dividend
IoT-ready HPUs with on-drive sensors (control pressure, oil level, temperature, filter differential pressure) plus optional pump-leakage, water-content, dissolved-air, and particle sensors feed cloud diagnostics that turn unplanned stops into scheduled service windows, per a 2021 OEM power-unit reference design that remains the dominant architecture cited in 2026 [S3].
Three service tiers are typical: a free tier for status read-out via browser or app, a paid alarm-trigger tier for threshold-based notifications, and a predictive tier using AI models trained on fleet data to forecast seal and pump wear weeks in advance, a tier that materially changes the downtime line on the TCO sheet.
The cost case is strongest where each unplanned stop is measured in tens of thousands of dollars: presses, plastic moulding, steel-mill hydraulics, and marine deck machinery. On a single press line running two shifts, a 1-2% scrap rate from leaky connections, around 2 downtime events per year at $4,000-$6,000 each, plus a 200 sq-ft (about 18.6 m^2) floor-space charge, can add $30,000-$50,000 to the annual operating cost of a legacy HPU versus a sealed, monitored alternative [S4].
Downtime, repair, and the spare-parts lead-time variable
Spare-parts lead time is rarely priced into acquisition decisions, even on operationally critical plant, and it is one of the most common TCO failures, per a 2026 UK procurement note [S1]. A pump that costs 20% less up front can carry a 6-week lead time and no local service partner, which converts a 4-hour planned swap into a 2-month forced outage on a single-shift line.
Modular manifold and cartridge-valve design on modern HPUs cuts mean-time-to-repair because sub-assemblies swap out without disturbing pipework, an architectural choice that is invisible at quote stage but dominates the repair line item on a 10-year cost model.
Two procurement signals to track in 2026: hydraulic power unit market size was reported at USD 11.82 billion in 2025 and a forecast USD 12.53 billion in 2026, with continued expansion through 2035, which is consistent with sustained spec-led, TCO-driven replacement cycles rather than commodity pricing [S6]. And energy-efficient, IoT-equipped units remain the dominant share of new industrial order intake per OEM reference designs published in the past 5 years and re-cited in 2026 procurement guidance [S1][S3].
Who benefits, and where the math breaks
TCO modelling pays back fastest on: continuous-duty industrial presses, plastic injection moulding, steel and metal-forming lines, marine and offshore deck machinery, and any HPU where unplanned downtime runs above $5,000 per hour of lost output. TCO is less decisive on mobile, occasional-use plant (trailer packs, agricultural attachments, tipper gears) where low purchase price and weight dominate, and on standby-only units where energy use is negligible. [S4]
Useful next nodes: the coolant distribution unit selection guide applies the same TCO template to a parallel fluid-handling system with similar contamination and energy drivers, and the sand reclamation unit reference is a useful comparator for capital-equipment TCO modelling in foundries running continuous hydraulic duty on the mould line.
This topic is covered further in Climbing Formwork Picks for Plumbing Riser Installation: 2026 Selection Map.