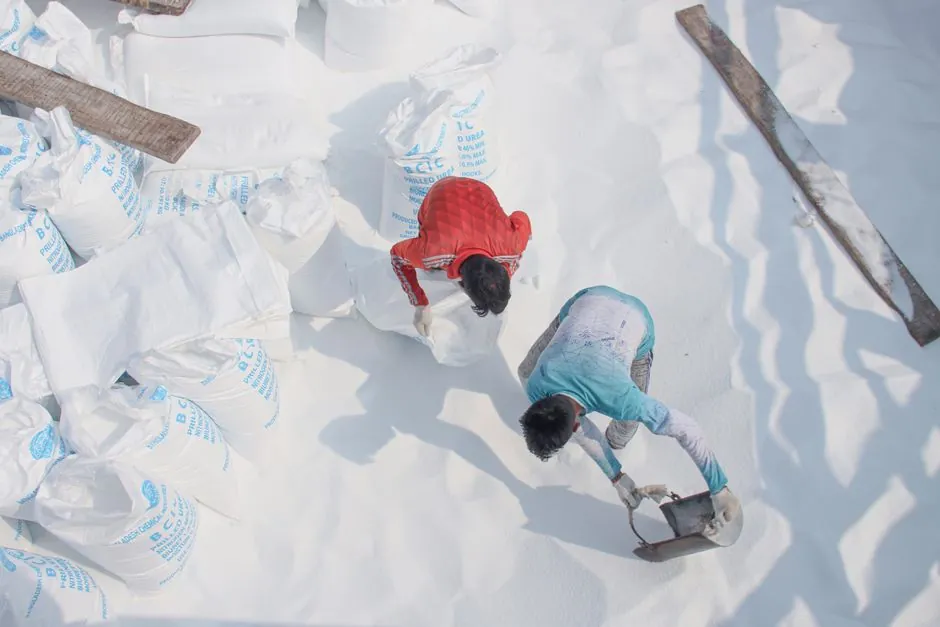
The lithium supply chain moves through four discrete stages, upstream mining, midstream refining, downstream cell and pack assembly, and end-of-life recycling, each with a distinct country footprint, capex profile, and bottleneck pattern [S1][S5].
Upstream extraction pulls lithium from two main sources: hard-rock spodumene ore, led by Australia, and continental brine evaporation ponds, led by Chile, Argentina, and increasingly the U.S. [S7]. Midstream refining converts that raw feedstock into battery-grade lithium carbonate (Li2CO3) or lithium hydroxide monohydrate (LiOH·H2O) before any cathode active material (CAM) plant can receive it [S8]. For a broader cost-and-chokepoint view, see this lithium carbonate upstream-downstream map.
Australia, Chile, and China together account for about 90% of global mined lithium output, with hard-rock spodumene dominating Australian volume and lithium-bearing brines driving Chilean and Argentine supply [S5]. The U.S. currently operates only one active mine, Silver Peak in Nevada, contributing roughly 1% of global production, while new projects in Nevada, California, and North Carolina are in development to lift that share [S5].
Brine-based operations work by pumping lithium-rich saline aquifers into large evaporation ponds, where solar concentration takes lithium chloride concentrations up to a level suitable for refining, a slow, water-intensive process that gives brine assets a long ramp curve versus hard-rock mines [S7]. A 2024 baseline dataset from USGS, company filings, and Bloomberg Terminal output confirms that the same three countries also dominate the company-level production totals for lithium, reinforcing upstream concentration as a structural rather than transitional feature [S4].
Midstream refining: where 72% concentration is the real story
China controls about 72% of global lithium refining capacity and roughly 77% of global lithium battery cell production capacity, a midstream dominance that is far more concentrated than the upstream mining footprint [S5]. Refining converts either spodumene concentrate (typically 6% Li2O) or evaporated brine into battery-grade lithium carbonate or lithium hydroxide, the two precursor chemicals that every CAM plant feeds [S8]. The U.S. holds only about 1% of global refined lithium capacity, which is the binding constraint on any "vertically integrated" U.S. battery strategy, because mined rock shipped abroad for processing reintroduces the import dependency the IRA was meant to remove [S5].
Capacity additions are coming: U.S. refining capacity is expected to grow more than 10 times over the next five years, supported by the Section 45X Advanced Manufacturing Production Credit, which has driven more than $126 billion in manufacturing investment announcements since inception [S5]. Even so, the industrial fastener supply risk 2026 for cell-factory construction steel, and the same IRA and CHIPS Act funding pool ($388 billion total), both feed the same physical build-out that refining must piggyback on. The midstream layer is also where geographic concentration creates systemic risk: a small number of East Asian processing hubs handle the bulk of nickel, cobalt, lithium, and manganese refining, so any policy or logistics shock there propagates downstream with little buffer [S4].
Downstream cell and pack: chemistry split and 950 GWh demand
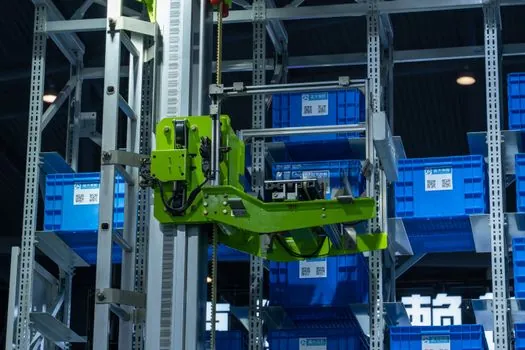
Global lithium battery demand reached approximately 950 GWh in 2023 across EV and stationary storage, against about 2,600 GWh of nameplate manufacturing capacity, and the U.S. alone is projected to lift lithium demand by almost 500% by 2030 [S5]. Cell chemistry matters: mainstream NMC (nickel-manganese-cobalt) cathodes pull lithium together with cobalt, nickel, and manganese, while LFP (lithium iron phosphate) uses more abundant iron and therefore a different midstream dependency profile, a contrast explicitly built into the 2024 mapping of six critical battery metals [S4].
Inside a finished cell, the bill of materials is fixed: a lithium-metal-oxide cathode, a graphite anode (with growing silicon additions), and a lithium hexafluorophosphate (LiPF6) electrolyte, each component with its own supply chain that adds another layer of geographic risk on top of the lithium itself [S4]. For a spec-first breakdown of how those materials add up inside a cell, this lithium-ion cell bill of materials analysis walks the cathode, anode, and electrolyte numbers side by side. Procurement teams specifying cells today should anchor any sourcing decision on chemistry, since an NMC buy and an LFP buy face very different upstream risk curves even when both use the same lithium precursor.
Who the chain is for, and who it is not for
This four-stage structure is for battery cell buyers, automotive OEMs planning gigafactory siting, ESS integrators sizing multi-year offtake, and policy teams modeling IRA or CRMA scenarios, all of whom need to see where the conversion step actually happens before they sign a long-term offtake [S1][S3]. It is not for end consumers shopping a single EV, nor for procurement of a dc power supply or a switching power supply module, where the relevant supply chain is electronics-grade copper, steel laminations, and magnetics, not brine or spodumene.
Spec-first cell buyers should treat midstream refining capacity, not upstream mine announcements, as the binding constraint on price and lead-time, because lithium carbonate and lithium hydroxide are fungible globally while refining lines are not [S5][S8]. For buyers choosing between a U.S.-assembled pack and a China-assembled pack, the trade is not just landed cost but also qualifying-component rules: U.S. IRA Section 45X credits apply to specific eligible components including qualifying battery components and applicable critical minerals, which is why the same industrial ups cabinet used at a U.S. gigafactory qualifies for a different credit than the lithium hydroxide that feeds its cells.
Demand projections and the 14x growth scenario
JRC's foresight work projects global demand for nickel, graphite, and lithium to grow by roughly 20x, 19x, and 14x respectively by 2040 versus 2020, with lithium specifically forecast to grow fivefold by 2030 and 14-fold by 2040 [S3]. Against that curve, global supply is projected to reach more than 2.14 million metric tons of lithium by 2030, but experts estimate a remaining supply deficit between 300,000 and 768,000 tons in the same year [S5].
Short- to medium-term deficits were expected for lithium in 2022-2023, with graphite market balance tight by 2024, manganese by 2025, and nickel through the end of the decade, before demand outstrips supply for all four materials beyond 2029-2030 unless new mining and refining capacity lands on schedule [S3]. The same JRC dataset notes that EU battery consumption will approach 400 GWh in 2025 and roughly 4x that by 2040, with e-mobility accounting for about 60% of total capacity in 2025 and 80% in 2040, a demand profile that any U.S.-based gigafactory RFP should be benchmarked against [S3]. For an RFP view that lines these numbers up against chemistry and TCO, this EV battery procurement strategy piece lays the buyer-side math out cell by cell.
Recycling, circularity, and the end-of-life stage
Recycling is the fourth supply-chain stage, and JRC estimates that by 2040 it could contribute up to 51% of EU cobalt demand and 42% of EU nickel demand, materially reducing primary extraction exposure in the latter half of the 2020s [S3]. A robust domestic supply chain is defined as spanning mining, processing, cell manufacturing and assembly, and recycling, with the recycling loop feeding black mass back into refining lines rather than into landfill or downcycle [S5].
For procurement teams, this means a 2026 sourcing decision on lithium precursor should price in a non-trivial recycled-content share by the early 2030s, especially for cobalt and nickel units, while lithium itself remains more dependent on primary extraction because of losses in the recycling yield curve [S3][S5]. Trackable signals to watch over the next two reporting cycles: U.S. refined lithium capacity additions under Section 45X, and the next USGS Mineral Commodity Summaries release for hard-rock and brine production totals by country.