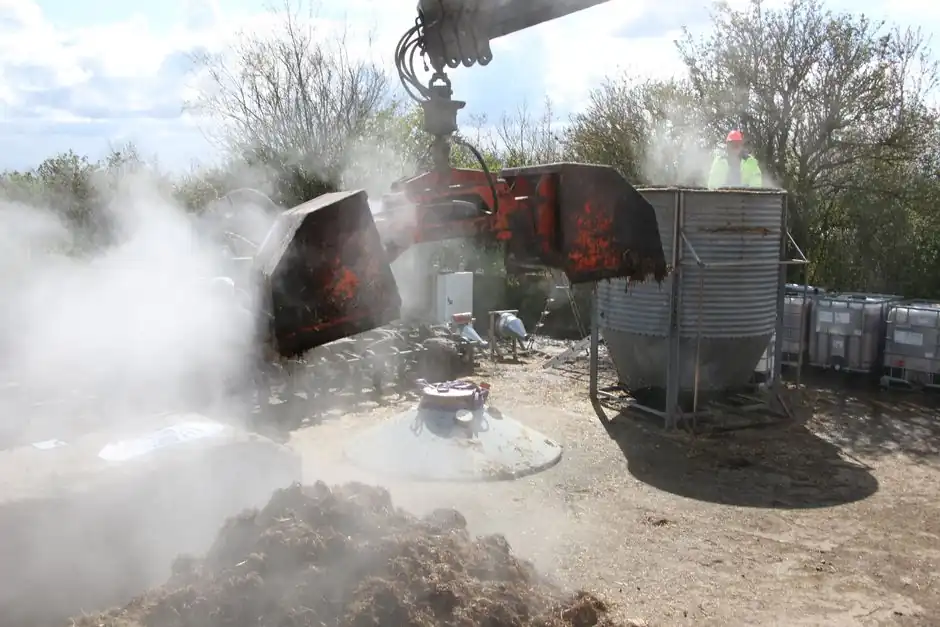
Engineers specifying a pneumatic conveying line in 2026 are expected to back the design with measured material data, not textbook correlations: throughput limits, plugging points, particle attrition, and elbow wear are all material-dependent, and a lab conveying test loop remains the standard tool for capturing them [S1][S3].
Empirical test work on bulk solids covers four operating behaviours, minimum conveying velocity, friability, abrasive wear against steel or ceramic targets, and line coating or buildup, each run across a sweep of gas velocities and solids loadings so the resulting curve can be read against a real pipeline rather than a vendor chart [S3][S4]. For dense-phase lines, especially with new materials, the test campaign itself is treated as the sizing tool, not a verification step afterwards [S6].
Why a Test Loop Comes Before Pipe Sizing
A pneumatic conveying test loop transports the actual product through a closed pipe in air, nitrogen, or other gas, sweeping line conditions from full suspension down to a moving bed so the operator can read the minimum conveying velocity directly off the rig [S1][S3]. Modern laboratory loops are built as modular, instrumented benches: differential pressure taps, solids mass-flow metering, transparent sections for high-speed video, and the option to heat or cool the carrier gas or run closed-loop with argon or CO2 for reactive or oxidisation-sensitive powders [S3].
University and supplier work published in 2025 continues to use this template. Chen et al. (2025) describe a self-developed experimental platform for systematic pneumatic conveying characterisation of a specific solid mixture (SSM), confirming that the platform-based approach is still the workhorse for academic data [S5]. Burdine's earlier loop design at UTC shows the same architecture is taught as the baseline rig for senior thesis work, which means it remains the de-facto reference for newer test stands [S1]. For engineers mapping onto a plant line, the test loop's first job is to mark where the material stops moving as a suspended flow and starts saltating, the boundary that defines the operating window in a real pipe.
What the Four Standard Tests Actually Measure
Jenike & Johanson, a recognised bulk-material testing lab, groups pneumatic conveying tests into four result types: conveying characteristics with minimum conveying velocity, particle attrition or friability, abrasive wear against impact plates of defined material (steel or ceramic), and line coating or buildup as a function of velocity [S3]. The same lab delivers a report package of graphs, tables, qualitative observations of surging and buildup, and video of conveying behaviour shot through transparent in-line sections, so the design engineer can match a curve to a plant scenario rather than read a single number [S3].
For hygroscopic or high-moisture products, an extra moisture-conditioning test is added: special attention is required before selecting a conveying system, and dehumidification of the conveying air or an air-conditioned room may be needed to keep the product stable through the line [S2]. For plastic pellets, which is a different failure regime dominated by smear, bridging, and fines generation rather than pipe wear, lab test rigs aim to simulate exact commissioning conditions and surface those risks before steel is cut [S10]. The point of running all four tests on the same rig is comparability: velocity, attrition, wear, and buildup can be cross-plotted against one variable, the superficial gas velocity, which becomes the master design parameter.
Dense-Phase and Long-Distance Lines Need a Different Test Bar
Dense-phase conveying, where the material travels as a plug or a slow-moving dune rather than a dilute suspension, is the regime where bench testing is treated as the design step, not a sanity check, because the correlation charts used for dilute-phase sizing lose accuracy once the solids loading pushes into plug flow [S6]. Nol-Tec's published guidance for dense-phase sizing is explicit: with new materials, the test is what validates the line diameter, booster spacing, and air supply pressure [S6].
Materials that compact, smear, bridge, or vary substantially in moisture are flagged as the dense-phase risk list, and these are exactly the products where an additional conditioning step is layered in front of the test, since the alternative is a line that plugs on the first shift [S8]. This is also the regime where conveying distance matters most: as distance grows, frictional losses push the gas velocity up, raising energy demand per ton moved, so a long-distance dense-phase line carries a higher penalty for an under-tested material than a short dilute-phase one [S2][S9]. The practical consequence is that a 200 m dense-phase line into a silo should not be sized from a vendor calculator; it should be sized from a velocity-vs-pressure curve that the test rig produced for the actual product at the actual particle size distribution.
Selecting Test Apparatus: Dilute Bench, Full-Scale Pilot, or In-Plant Trial
Three test tiers are in routine use, and the choice depends on the consequence of being wrong, the budget, and the available sample mass. A dilute-phase bench rig (typically 50-100 mm bore, 10-30 m straight run with a few bends) gives velocity, attrition, and wear data at low product volume (often 50-500 kg per test) and is the right tier for early material qualification [S1][S3]. A full-scale pilot (production-bore pipe, full booster and blow-tank arrangement, often 100-500 m equivalent) reproduces dense-phase behaviour and is used to validate the bench result against a real pressure profile.
For higher-risk products, a third option is rented in-plant capacity at a toll processor, which lets the team run the real material through a production unit for a few days before the line is fabricated. Selection trade-offs across the three tiers: bench rigs score low on cost (USD 5k-25k typical campaign range based on lab quotations) and short lead time (2-6 weeks) but cannot capture full-scale dense-phase pressure drop; full-scale pilots cost more and need 1-5 t of product, but give dense-phase and long-distance data; in-plant trials give the most faithful data but tie the team to a third-party schedule. For new product introductions in food, pharma, and battery powder handling, suppliers such as Jenike & Johanson run both the lab bench and the data review, and publish a typical report turnaround window tied to the test matrix [S3].
Reading Test Results Into the Design
Test data enters the design through four engineered outputs: a minimum conveying velocity (Vmin) that sets the lower bound on operating gas velocity, an attrition curve that limits the number of bends and the line length for friable products, an abrasive wear rate that sets elbow material (standard carbon steel vs hardened vs ceramic-lined) and replacement interval, and a buildup curve that sets cleaning-cycle frequency and may force a larger line diameter to keep the cross-section clear at low-velocity points [S3][S4]. The delivery format matters: results come back as graphical and tabular data plus qualitative observations, with the test engineer walking the design team through the conclusions rather than handing over a raw data dump [S3].
Beyond static outputs, the test report typically includes video of the conveying behaviour through transparent sections, which is what catches surge and saltation events that a pressure trace alone misses, and which is especially useful when the design team is remote from the test lab [S3]. For decision-makers, the practical threshold to watch is the margin between the design operating velocity and Vmin: a margin under 1.5 m/s is widely treated as a red flag in the conveying community because day-to-day variation in moisture, particle size, and feed rate will push the line across the saltation boundary. Where this margin cannot be widened without raising energy cost, the test data is also used to redesign the feed point, the airlock, or the line routing to push the operating window up [S9].
Limits, Failure Modes, and When a Test Does Not Save You
A test campaign is only as good as the sample fed into it. If the production material varies in moisture, particle size distribution, or bulk density over the year, the test captures only one point on that envelope, and the design should be qualified for the worst case or run with on-line conditioning [S2][S4]. A second limit is scale-up from bench to plant: dense-phase pressure drop does not always scale linearly, and the only honest way to check is a full-bore pilot or, where the budget allows, an in-plant trial on a sister line.
A third failure mode is testing the wrong product form. Plastic pellets that look fine at room temperature in the lab can smear and bridge against a hot blow-tank in summer; food powders that flow well at 5% moisture can pack hard at 9%; a conveying air supply that worked on the bench with dried, oil-free instrument air may run with humid plant air and pick up 1-2% moisture in transit [S2][S8]. The published industry guidance is consistent: materials that compact, smear, bridge, or vary substantially in moisture require testing and additional conditioning before dense-phase commitment, not just a line-sizing calculation [S8]. This connects directly to broader plant-engineering practice where digital twins in process development are increasingly used alongside, not in place of, physical trials, and where the material test before pneumatic conveying step is treated as the gate a digital model must clear before being trusted.
Standards, Sourcing, and How to Read a Test Report
There is no single ISO or ASTM standard that mandates a pneumatic conveying material test, which is why published test programs vary in their apparatus geometry, gas conditions, and reporting format. The workhorse references are the equipment-maker test protocols (Jenike & Johanson, Nol-Tec, Fuller Technologies) and the academic literature on test loop design, such as Burdine (2018) and Chen et al. (2025), which collectively define the geometry, instrumentation, and reporting format that the bulk-material community treats as standard practice [S1][S3][S4][S5][S6].
For a buyer, a credible test report includes: the apparatus description and pipe geometry, the gas used and its temperature and pressure, the material description (particle size distribution, moisture, bulk density), the test matrix of gas velocities and solids loadings, the four result curves (Vmin, attrition, wear, buildup), the video, and a written conclusion with design recommendations [S3]. The report should also flag any deviation between the tested condition and the proposed plant condition, because unflagged deviations are the most common route for a passing bench test to result in a failing plant line. Watch for 2026 supplier bulletins: Nol-Tec, Jenike & Johanson, and Fuller Technologies all refreshed their public guidance in 2025-2026, and the practical test matrix has not changed but the emphasis on empirical, material-specific campaigns has hardened [S4][S6][S8].
Two trackable signals into late 2026: the AIChE Flow of Solids / Pneumatic Conveying combo course at Jenike & Johanson headquarters in Tyngsborough, MA, on 20-22 October 2026, and the ADM Montréal 2026 Battery Powder Handling session on 10-12 November 2026, both of which are expected to publish updated test-rig data and case studies on dense-phase and long-distance lines, and which are the practical places to confirm whether the four-test template above has shifted toward more wear-focused or more buildup-focused campaigns [S3].
Spec-level background on the components involved: electronic test, and measurement test.