
Global molybdenum demand is set to grow at a 4.7% CAGR from 2026 through 2036, taking the market from USD 362.6 billion in 2026 to USD 573.9 billion by 2036, with an incremental opportunity of USD 211.36 billion over the decade [S2].
World reserves stood at approximately 15.00 million tons in 2024 with annual mine output of roughly 260,000 tons, of which China is the largest single producer and the United States holds an estimated 5.4 million tons in identified resources [S3]. Procurement teams should plan for a market in which the power supply and industrial UPS value chain they rely on is structurally tied to the same refractory metals that feed stainless steel mills, so a constraint in ferromolybdenum or roasted concentrate quickly propagates into alloyed-component lead times.
Reserves, Mine Production, and the By-Product Trap
Outside China, most molybdenum is recovered as a by-product of copper mining, meaning that supply does not respond cleanly to molybdenum price signals [S5]. A roaster operator that buys unroasted molybdenite concentrate from a copper mine cannot simply ramp output when the Mo price spikes; the host mine's copper cut dictates the upstream volume, and the roaster inherits a fixed-elasticity feedstock.
Roasted molybdenite concentrate can be blended from multiple origins, even inside vertically integrated facilities, which dilutes provenance but does not add tonnage [S5]. The blending buffer is real for steelmakers chasing a target FeMo grade, but it is a redistribution tool, not a substitution tool, and it cannot offset a 6 to 12 month copper-mine curtailment.
Procurement planners should treat the by-product structure as the single largest concentration risk: a copper-led capex cycle in Chile or Peru, or a permit freeze in the U.S. West, removes molybdenum tons without anyone ever naming molybdenum in the project sanction.
Form Factors and Where the Margin Sits
Molybdenum is traded in three principal intermediate forms: unroasted molybdenite concentrate (MoS2), roasted molybdenite concentrate (MoO3), and ferromolybdenum (FeMo), with downstream conversion into molybdenum metal powder, wire, rod, and sheet [S5]. The 2026 form-segment view puts powder molybdenum at a 36.5% share of total market value, the largest single form, while stainless-steel-grade molybdenum takes 15.7% of application share and Full Alloy Molybdenum leads product form at 19.0% [S2].
High-purity spherical molybdenum powder, made by hydrogen reduction of MoO3 or ammonium dimolybdate under tight atmospheric control, carries a 2,623°C melting point, high thermal conductivity, low thermal expansion, and strong corrosion resistance, which is why it is specified into semiconductor sputtering targets, heat sinks, and additive-manufactured aerospace parts [S3]. The 2026 powder sub-market alone is sized between USD 0.8 billion and USD 1.6 billion, and is forecast to grow at 5.0% to 7.0% CAGR through 2031, with Asia-Pacific leading at 5.5% to 7.5% regional CAGR [S3].
Application Pull: Stainless Steel, Oil and Gas, and the Semiconductor Overhang

Stainless steel grade molybdenum is projected to hold a 15.7% share of the 2026 application segment, while chemicals and petrochemicals is set to take 15.7% of end-use, oil and gas leads application at 19.0% share, and Full Alloy Molybdenum leads product form at 19.0% [S2]. Demand is being pulled by three concrete engineering constraints: high-temperature strength in pipeline and pressure-vessel steels, sour-service corrosion resistance (NACE MR0175 environments) in upstream equipment, and thermal management in semiconductor and high-performance computing (HPC) hardware [S2][S3].
The U.S. market is forecast to grow at 5.3% CAGR and South Korea at 5.0% CAGR through 2036, both rates above the global 4.7% baseline, reflecting domestic capacity investment in the U.S. and end-use sector modernization tied to South Korean electronics and battery materials supply chains [S2]. This is relevant to a procurement team because the switching power supply and DC power supply manufacturing footprint in those two countries is a direct sink for high-purity Mo targets and Mo-Cu heat-spreader substrates.
When stainless mills, EPC yards, and semiconductor fabs all pull from the same powder and FeMo tonnage, allocation cycles at the roaster stage become the binding constraint, not headline price.
Comparison of Molybdenum Product Forms Against Procurement Criteria
For a spec-first procurement workflow, the three product forms resolve to different risk profiles. Molybdenite concentrate (MoS2) trades on a 50% to 57% Mo content basis, is the lowest-cost form, but requires downstream roasting and SO2 abatement capacity, and is dominated by mine output from copper by-product streams [S5]. Roasted concentrate (technical MoO3) carries 57% to 58% Mo with low Cu and S, is the workhorse feedstock for FeMo and chemical-grade applications, and is the form where blending across origins is most common, which dilutes single-mine traceability but eases chemistry locking [S5].
Molybdenum metal powder, particularly high-purity spherical grades for additive manufacturing and semiconductors, sells at multiples of FeMo on a contained-Mo basis, is the highest-margin segment, and is the most exposed to chain conveyor-style industrial-spec demand swings [S2][S3].
The decision rule is straightforward: specify by end-use. Stainless and structural steel can absorb FeMo or technical oxide with a tight chemistry envelope, while sputtering targets, HPC heat sinks, and aerospace AM parts must be qualified against powder-grade specifications and batch-level certificates of analysis.
ESG, Due Diligence, and the IMOA Briefing
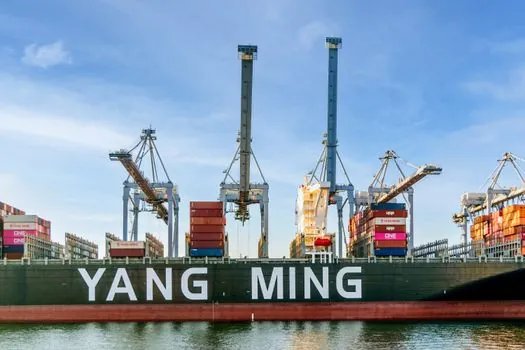
The International Molybdenum Association briefing, authored with TDi Sustainability, finds that environmental, social, and governance risks in the molybdenum chain are relatively well managed overall, with the principal mining-stage risk tied to acid rock drainage from sulphide ores (molybdenite is a sulphide) and the principal processing-stage risk tied to SO2 emissions from roasting, which require desulphurisation systems to control [S5].
Outside China, the mining-stage operations are typically run by large, publicly listed companies under national regulatory oversight, which simplifies OECD-aligned due diligence documentation but does not remove the by-product-volume linkage to copper cycle decisions [S5]. For a procurement team running a battery management system or UPS build under a 2026 spec-first policy, this is a tractable risk: ISO 14001, IFC Performance Standards, and OECD-aligned chain-of-custody documents are available from major miners, and IMOA member material can be sourced with disclosed ESG profiles. See Battery Management System Supply Chain 2026: Capacity, Pricing, and End-of-Life Routing for how the parallel lithium-ion supply chain is being qualified under the same OECD-style due diligence pressure.
What Can Break the 2026 Supply Plan
Three failure modes are visible from the research: a transport-led delivery shock, a copper-led tonnage cut, and a purity-led qualification gap. Argus Media flags transport delays and geopolitical tensions as the main near-term risks to demand growth over the next decade, with supply chain disruptions named as a primary headwind [S4].
On the tonnage side, a copper-mine curtailment in Chile or Peru removes molybdenum tons without a corresponding price signal at the mine gate, because the host metal sets the operating envelope [S5]. On the purity side, semiconductor-grade powder qualification typically runs 6 to 18 months for a new supplier, so a buyer who waits for a price dip before qualifying a second source is exposed to single-supplier allocation if the primary roaster has a maintenance event [S3].
A useful next node to watch is the 2026 IMOA supply chain briefing refresh, which historically updates ESG risk indicators and member-shipper disclosures on an 18 to 24 month cycle. A second trackable signal is the Q4 2026 Argus molybdenum price assessment, where sustained premium of roasted concentrate over FeMo on a contained-Mo basis would indicate powder and FeMo conversion capacity is binding, a leading indicator of powder allocation tightening into 2027 fab ramp schedules.