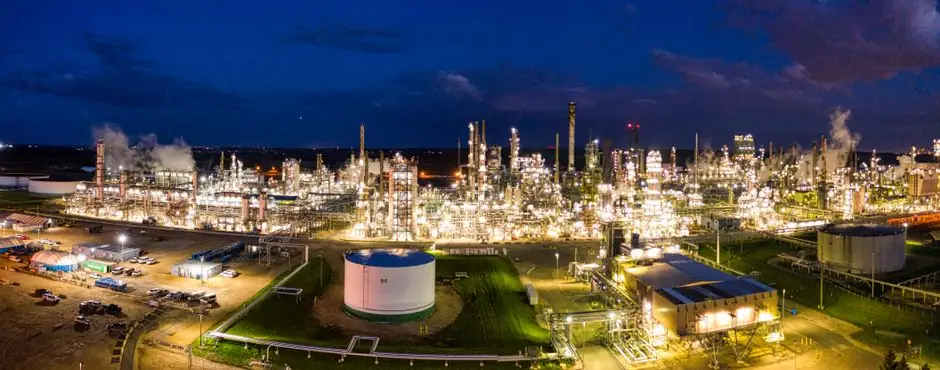
U.S. marketed natural gas production averaged 118.5 Bcf/d in 2025, up 5.3 Bcf/d year on year, with Appalachia (36.6 Bcf/d, 31% share), Permian (27.7 Bcf/d, 23%), and Haynesville (14.9 Bcf/d) together delivering 67% of supply and 81% of net growth [S1].
Permian growth was driven by associated gas at a rising gas-to-oil ratio, supported by WTI around $65/b in 2025 against Midland and Delaware breakevens of $61/b and $62/b respectively [S1]. Henry Hub averaged $3.52/MMBtu, up 60% versus 2024, keeping Haynesville economic despite 10,500–13,500 ft well depths [S1].
Where the Capacity Bottleneck Actually Sits in 2026
Appalachia added only 1.1 Bcf/d in 2025 versus 0.046 Bcf/d in 2024, with FERC authorizing the Mountain Valley Pipeline in June 2024 finally unlocking takeaway that had throttled the basin for years [S1].
On the export side, the binding constraint has shifted: shipping and logistics, not production capacity, are now the primary brake on U.S. LNG shipments, per the AGA market indicators dated 25 June 2026 [S9].
Globally, the IEA-aligned supply forecast still leaves a 120 Mt/yr net LNG capacity gap by 2040 under stated demand trajectories, which is reshaping liquefaction train sizing from small-scale distributed modules to large baseload export terminals [S2].
Spec Criteria: Reservoir, Surface, Pipeline, Storage
Capacity planning must reconcile four independent constraints: well productivity and decline curves, surface facility throughput (separators, compressors), pipeline takeaway, and storage cycling windows [S3].
For gas treating and liquefaction, the critical spec envelope is feed-gas cleanup: mercury, sulfur compounds, water, and heavy hydrocarbons must be removed upstream of the liquefier to protect brazed-aluminum heat exchangers and meet product specifications [S2].
Operators evaluating incremental wells should model the gas-to-oil ratio sensitivity explicitly, since Permian GOR has trended upward and directly converts oil-directed drilling into gas supply without incremental capex [S1].
Who Needs Formal Capacity Planning, and Who Does Not

Integrated NOC and IOC upstream operators with multi-basin portfolios need formal, software-driven planning because they juggle thousands of wells across heterogeneous gathering systems; the cost of an over-forecast in the Permian alone can exceed $1 billion in stranded midstream commitments [S3].
Single-well producers and stripper-lease operators typically run leaner, scheduling against a single gathering agreement and one offtake pipeline; for them, a maintained production database and a one-page decline-curve refresh per quarter is sufficient.
Downstream LNG developers sit on the demand side of the same ledger: a 120 Mt/yr gap by 2040 means spec choices on liquefaction train size, refrigerant mix, and pretreatment skid modularity are first-order investment decisions, not late-stage details [S2].
Software, Load Profiles, and the New Demand Pull
Modern production planning platforms now combine reservoir models, field sensor streams, and market forecasts in a single solver, replacing spreadsheet chains and letting planners rerun scenarios in minutes rather than weeks [S3].
On the demand side, gas-fired generation is projected to grow 7.3% between 2025 and 2027 in a high-AI-demand scenario, which tightens the planning window for utility offtakers and raises the value of interruptible transport versus firm service [S7].
Load profiles at the customer level are the unit of work for utility-scale planning: seasonal heating swing, manufacturing shift patterns, and planned maintenance windows all flow into the same pipeline, storage, and utility capacity balance [S4].
Practical data points to capture per [S4]: hourly consumption shape across weekdays and weekends, temperature sensitivity per MMBtu per heating-degree-day, scheduled downtime from turnaround calendars, and any on-site backup fuel (typically propane or distillate) that can shave peak demand.
Monitoring, Emissions, and Methane as a Planning Variable
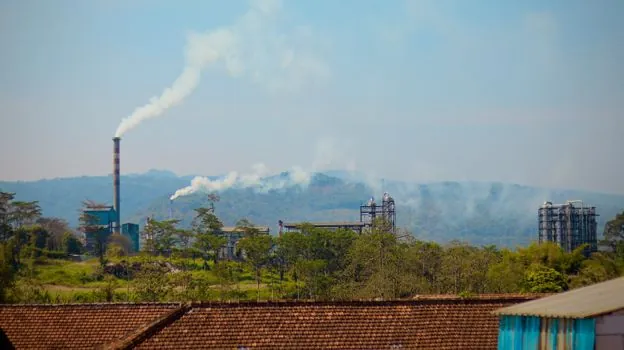
Methane intensity is now a planning input, not a reporting afterthought: continuous emissions monitoring, fixed gas detection on process areas and tank farms, and fugitive emissions management are integrated into LNG plant digital twins to keep product within carbon-intensity thresholds [S2].
Fixed detectors such as the Sensepoint XCD and XNX universal transmitters are specified for continuous monitoring of LNG process areas, tank farms, and loading facilities where methane or heavier hydrocarbons may be released, typically paired with flame and gas detection controllers for life-safety coverage [S2].
This is the same instrumentation family that supports gas detection and gas analyzer loops on the upstream side, and the specification language is increasingly aligned across wellpad, processing plant, and export terminal.
Industrial Gas Specification at the Burner Tip
For combined-heat-and-power and on-site generation behind the city gate, planners should validate five specs before committing to a gas supply contract: deliverability and pressure at the meter, firm versus interruptible service terms, available standby fuel capacity, metering accuracy class, and any winter reliability program the LDC operates [S6].
Gas composition at the burner tip matters for NOx, flame stability, and turbine warranty compliance; in practice this means requesting a 12-month rolling gas chromatograph report from the LDC and cross-checking it against any gas chromatograph reading on the customer-side skid.
Filtering at the regulator station is a small but high-leverage spec point: coalescing and particulate gas filters protect the meter run and the burner orifices from liquids and compressor carryover, and the change-out interval is a useful proxy for upstream gas quality.
Signals to Watch Through Year-End 2026
Three trackable signals will determine whether the 2026 capacity envelope holds: (1) whether the AGA shipping-and-logistics constraint eases as new LNG carrier tonnage delivers, (2) whether AI-driven power demand tracks the high-case 7.3% gas-generation growth between 2025 and 2027, and (3) whether Appalachia adds another pipeline project of Mountain Valley scale to relieve the residual takeaway ceiling [S1][S7][S9].
On the supply side, Haynesville economics remain the swing factor: at $3.52/MMBtu Henry Hub the deep play is still economic, and any retreat below roughly $3.00/MMBtu would slow completions and tighten winter peak supply within 6 to 9 months [S1].
Related analysis: Dock Leveler Spec Map for Automotive Parts Logistics.