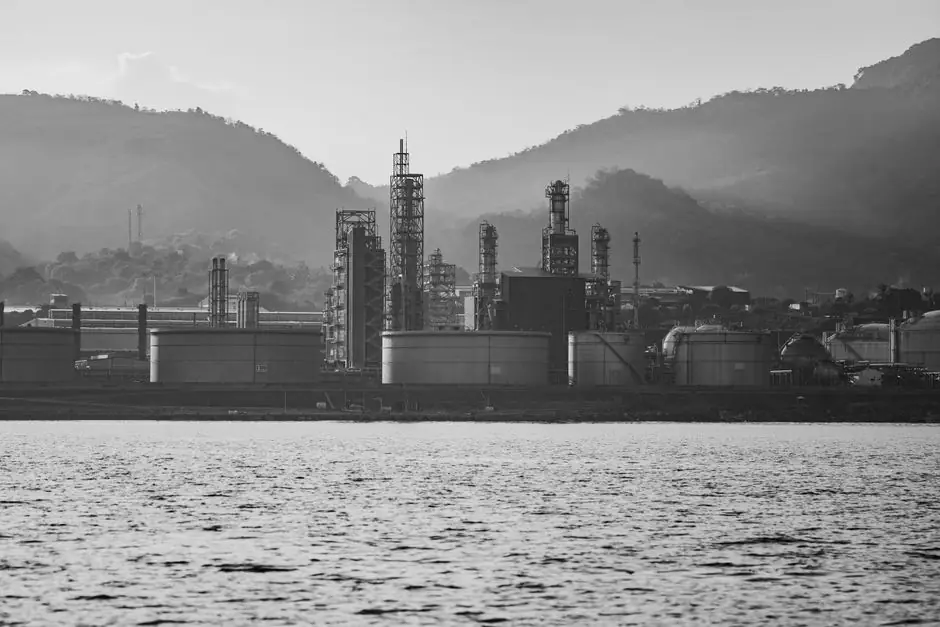
For an engineer sizing a budget or auditing a procurement decision, the practical cost stack looks like: raw material (naphtha, ethane, propane, butadiene, benzene) plus utilities (steam, fuel gas, electricity) plus fixed capital recovery, with catalyst, labor, and maintenance typically single-digit percentages each on a steam-cracker P&L [S4].
Feedstock cost: the line that decides everything else
On a steam-cracking complex built around liquid feedstocks, naphtha historically accounts for the majority of variable cost, and any swing in crude oil price flows through to the petrochemical P&L within one to two quarters because of inventory rollover [S4]. Gas-fed crackers (ethane, propane) compress that ratio and shift advantage toward regions with stranded ethane, which is why U.S. Gulf Coast ethylene cash cost has run structurally below Northwest Europe and Northeast Asia on a per-tonne basis in much of the past decade. The choice between naphtha and ethane is not just chemistry, it is a logistics decision: pipeline access, gas-processing NGL recovery, and marine terminal capacity all feed into the realized feedstock price [S4].
Aromatics complexes (benzene, toluene, xylenes) layer a second feedstock on top of the reformer: reformate or pyrolysis gasoline. The cost stack here adds a hydrotreater, an extraction unit, and an isomerization or transalkylation section, and each extra conversion step adds utilities proportional to its delta-T and hydrogen consumption. Refinery-integrated petrochemical assets can re-use internally generated hydrogen, which materially lowers the cash cost versus a stand-alone merchant plant [S4].
Energy and utilities: the second axis process engineers must size
Energy is consistently the second-largest cost bucket for steam crackers and aromatics plants, with fired-heater fuel gas, HP/MP steam, and electric drives for compressors all visible line items in a typical OPEX split [S4]. Integration via pinch analysis, with hot reformer effluent preheating feedstock and MP steam raised in the convection section, can cut external energy demand by 20–30% on a well-optimized design, and ISO 50001 energy-management systems have become a baseline expectation for new builds in Europe and parts of Asia.
Utilities tie back to instrument choices across the plant: pressure transmitters on steam headers, flow meters on fired-heater pass tubes, and control valves on let-down stations each carry a measurement uncertainty that compounds into the energy balance. A 1% bias in fuel-gas flow measurement across a 1,000,000 t/yr ethylene plant translates into a 7-figure annual fuel cost swing, which is why custody-transfer-class metering is standard on battery-limit interfaces.
Capital recovery, catalyst, and maintenance: the smaller buckets that decide uptime
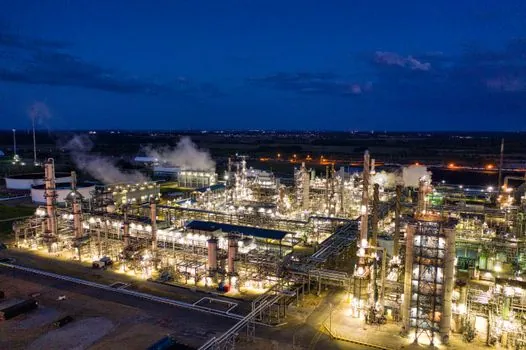
Fixed capital depreciation, catalyst, labor, and maintenance together typically sit in the mid-teens to low-twenties percent of total cost on a fully-burdened basis, and they dominate the discussion on a marginal-cash-cost basis once a plant is built and the depreciation schedule is locked [S4]. Catalyst cost in steam crackers is modest in absolute terms, but cycle life and selectivity losses in the reformer and in downstream units (e.g. hydrotreating, isomerization) directly shift yield to the higher-value product slate.
Maintenance cost is highly variable: a turnarounds-driven model (T&I every 4–6 years on a major unit) front-loads maintenance into discrete spend peaks, while predictive maintenance using pressure sensors, vibration, and infrared windows can smooth the curve. In a properly instrumented plant, condition-monitoring data feeds the PLC-level trip logic and the site historian, and unscheduled downtime drops into single-digit percent of annual operating time, which is the single largest lever a maintenance team controls.
Total cost of ownership: a comparison across process routes
A criteria-based comparison of the four main petrochemical process routes (steam cracking of naphtha, steam cracking of ethane, catalytic reforming to aromatics, and methanol-to-olefins) lines up as follows: feedstock cost is lowest on ethane cracking and highest on naphtha cracking at parity crude price; energy intensity is highest on MTO and lowest on ethane cracking; capital intensity is highest on MTO and lowest on naphtha/ethane retrofits; carbon intensity per tonne of product is lowest on ethane cracking and highest on MTO when grid carbon is high. Any one of these cells can flip the ranking for a specific site, which is why a one-size-fits-all benchmark should be read as a starting point, not a verdict [S4].
Linked reference: a deeper look at the spec gates and instrumented feedback loops that drive these rankings is in petrochemical capacity planning: spec gates, modeling methods, and instrumented feedback, and a related comparison on LNG production line design: feed gas, liquefaction cycle, and 2026 capacity gates lines up the same cost stack against the cryogenic LNG train case where feed-gas treating and mixed-refrigerant compression dominate OPEX.
What moves the number: TCO variables engineers actually control
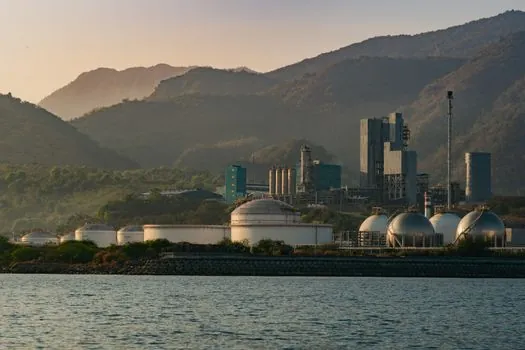
Total cost of ownership on a petrochemical asset has four controllable levers: feedstock mix and substitution (ethane vs. naphtha vs. LPG), energy integration depth (pinch, heat-recovery steam generation, turbine drivers), catalyst and consumables (cycle length, precious-metal loadings, molecular-sieve replacement), and reliability program maturity (predictive maintenance coverage, turnaround scope discipline) [S4]. Off these, the SCADA and supply-chain layer is increasingly a fifth lever: see SCADA system supply chain 2026: sourcing map and risk gates for the procurement-side picture, where control-system hardware and OT cybersecurity audit spend are now a visible line in capex requests.
Limits and failure modes to flag: feedstock-price hedging is the highest-leverage financial instrument available, and a swing in naphtha-vs.-ethane spread of 100 USD/t can flip the cash-cost ranking between two otherwise equivalent crackers; catalyst poisoning by sulfur or oxygenates is the most common avoidable yield loss, and online pressure transmitters on guard beds are the standard mitigation; energy-price volatility, especially on natural gas for fired heaters, can double the OPEX line within 12 months and should be modeled with two scenarios at minimum.
Standards, sourcing, and what to track next
The standards that touch petrochemical cost most directly are API 610 / API 617 on rotating equipment, ASME B16.5 / B16.47 on flanges, ISO 14001 and ISO 50001 on environmental and energy management, and NACE MR0175 for sour-service metallurgy, all of which carry both an upfront spec cost and a long-tail OPEX implication through inspection intervals and consumables life. ATEX 2014/34/EU and IEC 60079-series govern hazardous-area equipment, and any cost comparison across geographies must reconcile ATEX/IECEx/NEC zoning to a like-for-like basis, otherwise the equipment line itself is not comparable [S4].
Trackable signals to watch over the next two quarters: ethane export terminal utilization on the U.S. Gulf Coast (proxy for ethane-cracker feedstock pull), reformer catalyst reload cycle times across Asian aromatics complexes (proxy for energy-integration maintenance backlog), and ISO 50001 certification counts in the EU petrochemical sector (proxy for energy-management OPEX discipline). For related adjacent cost stacks, see Heat pump market share by manufacturer: 2026 supplier landscape for the energy-equipment side, and Gearbox certification checklist for motor control cabinet integration for the rotating-equipment cost line that ties into compressor-driven OPEX.