A truck crane load chart is a moment-limit map, not a single weight number, and the rated capacity at any working radius is the figure that must be used on the day of the lift [S2].
Every OEM publishes one for each boom length, outrigger spread, and counterweight configuration, and operators in North America are expected to apply it under Power Crane and Shovel Association (PCSA) stability margins [S5].
What the Chart Actually Plots: Radius on X, Capacity on Y
On a curve-type load chart the horizontal axis is the working radius in metres or feet, the vertical axis is the maximum permissible load, and each curve corresponds to a fixed boom length and a fixed outrigger state [S2]. The chart on the Grove RT555-1 shows exactly that pattern: at a 10 ft radius with a 35 ft boom on fully extended outriggers the gross rating is 110,000 lb, while the same configuration drops to roughly 12,600 lb at a 46.2 ft radius on a 50 ft boom [S5]. Operators read the live radius, then read up to the boom-length curve, then across to the capacity number, never the other way around [S6].
Grove RT555-1 data shows 34,100 lb over the front at 65 ft boom and 30 ft radius [S5], consistent with the principle that lifting capacity decreases as radius increases [S6][S7].
Gross Capacity vs Net Capacity and the Deductions That Eat Your Margin
Gross, or rated, capacity is the chart number; net capacity is what the hook may actually carry after the OEM-defined deductions are subtracted, and the two are never the same on a real lift [S3]. Typical deductions include the main load block, the jib (stowed or erected), any headache ball, all rigging, and the hanging cable weight, and the same chart line-itemises them as a percentage of chart capacity rather than as a fixed pound figure [S3][S5].
The Groves RT555-1 list shows the magnitude: hook and ball 239 lb, 25 t four-sheave block 690 lb, 30 t five-sheave block 888 lb, 40 t six-sheave block 913 lb, and these alone can pull 1-2% off the chart figure on a 50 t pick [S5]. A common field error is to read the chart as if those weights were free, which on a 20,000 lb lift at full extension can silently over-rate the crane by 4-5% and put the structural back of the boom into the plastic range [S3][S1].
Boom Length, Boom Angle, and the Geometry Behind the Curve
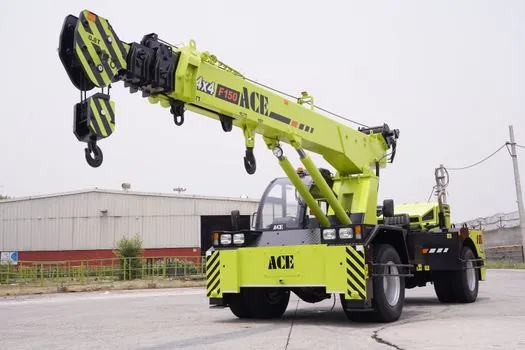
For a fixed radius, a longer boom runs at a higher elevation angle, and a shorter boom at a lower one, so the chart couples boom length to radius, not to angle, in a way the operator has to back out [S2]. Sany's training reference puts it bluntly: with boom length fixed, a flatter angle lengthens the radius and drops capacity; with angle fixed, a longer boom adds deflection and drops capacity again, so capacity is the dependent variable in both directions [S2].
On Outriggers, On Tyres, and Over the Front vs 360 Degrees
Load charts split into two families of cases: on outriggers (full stability) and on tyres (limited stability, often 75% of the outrigger figure on rough-terrain cranes), and within each family there is a further split between over the front and full 360 degree rotation [S5]. The Grove RT555-1 lists stability ratings of 85% on outriggers and 75% on tyres, and the difference between over-front and 360 numbers at the same radius is typically 2-5%, growing at long radius where the worst-case tipping line is closer [S5].
For the Liebherr LTC 1055-3.1 55 ton class truck crane, the same principle applies: counterweight, outrigger spread, and tyre pressure each create a separate column family on the chart, and the operator must read the column that matches the physical setup on site, not the one above it [S4]. Choosing the wrong column is the single most common route to a tip-over event in NCCCO incident summaries, because the chart number that looks safe is actually the 360-on-tyres figure being mis-applied as the over-front-on-outriggers figure [S3].
Reading the Chart in Practice: A Worked Example at 20 ft Radius
Preston Rentals walks through a textbook 5 tonne (≈11,000 lb) lift at a 20 ft (≈6.1 m) radius on a mobile crane where the chart lists only 4.2 tonnes (≈9,260 lb) at that radius, a 0.8 tonne shortfall that would push the crane past its tipping line in seconds [S1]. The first step is to confirm the actual radius on site with a laser rangefinder or direct measurement, not the radius the rigger estimated off the drawing [S2]. The second step is to choose the boom-length column that matches the boom actually extended, including any stowed jib, because a stowed jib still appears as a deduction row in most OEM charts [S3]. The third step is to subtract all capacity deductions to get the net number, compare it to the rigged load weight, and stop the lift if the net figure is below the load [S3].
A digital crane load chart calculator from a rental house or OEM can run those three steps in one input, but the calculator is only as good as the column it is fed, and an outrigger-not-fully-extended condition can still invalidate the result [S1].
Capacity Drop-Off Across the Truck Crane Range: 3 t to 130 t
The North American fleet in the TNT Crane reference list runs from 3 ton Broderson IC-20 picks to 130 ton Link-Belt ATC-3130 all-terrain units, and the radius-versus-capacity curves flatten out as the maximum rating climbs because the structural section depth grows faster than the boom length [S4]. A 15 ton unit such as the Grove YB5515 or Tadano GR-150-1 is a typical service truck with a 4-5 t capacity at 30 ft radius, while a 100 ton Demag AC 80-2 holds 20-25 t at the same 30 ft, a roughly 5x lift for a 6-7x weight class [S4]. Above 100 t the trend reverses: bigger cranes gain reach faster than they gain capacity, so a Liebherr LTM 1100-5.2 120 ton all-terrain will out-reach a 60 ton truck crane by 30-40 ft at any equal percentage of its chart capacity, useful information when a pick has a high hook height but a moderate weight [S4].
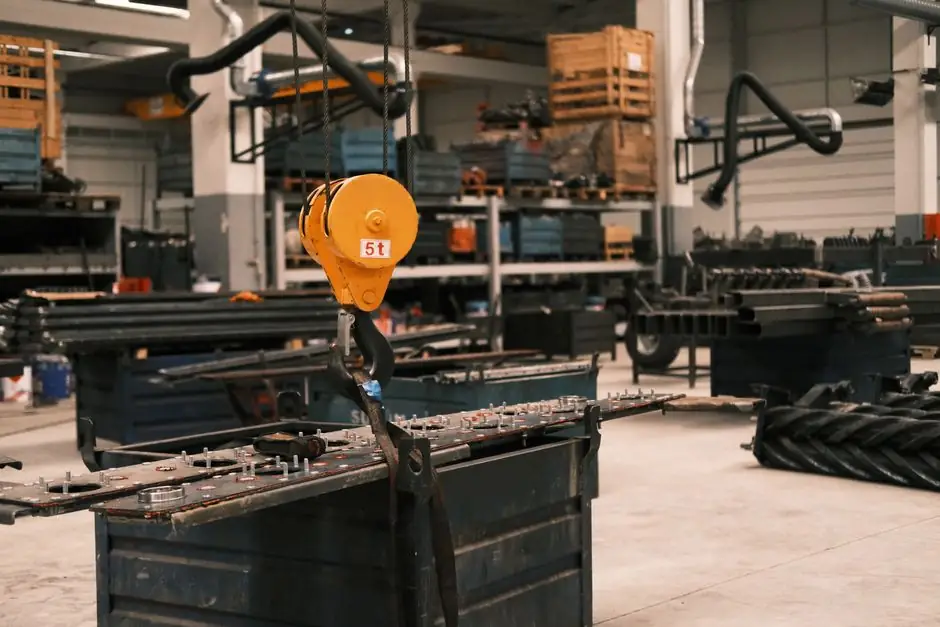
For an even more direct comparison, the electronic load and load cell hardware mounted between the hook and the block is what turns those chart numbers into a live readout on the operator's LMI screen, and that hardware is the only way to confirm the chart prediction in real time on a 50-130 t lift [S3].
Limits, Failure Modes, and What the Chart Will Not Tell You
The chart assumes level ground, a fully rigged machine, the OEM counterweight, and the OEM hook block; it does not account for soft soil under one outrigger pad, a side slope of more than 1-2 degrees, or a pick with line pull beyond single-line reeving [S2][S5]. Going past the chart at long radius is the dominant failure mode in tip-overs because the moment arm grows linearly while capacity falls off, so a 10% radius overshoot can cost 25-30% of chart capacity, the exact margin the deductions already ate [S1][S7].
For procurement or rental decisions the chart also encodes the boom-extension limits: a 55 ton unit such as the Liebherr LTC 1055-3.1 at 110 ft boom is rated for 1,800 lb at 106.17 ft radius, which is essentially a personnel-basket or light-roof-lift envelope and not a structural-steel pick envelope, so any spec sheet that quotes "55 ton capacity" without the radius is misleading by a factor of 30 or more [S4][S5].
Standards, Sourcing, and Where the Numbers Come From
OEM range diagrams and lifting-capacity tables are issued as controlled documents with a revision date, a stability percentage, and a PCSA class number, and the format is intentionally non-substitutable across manufacturers [S5]. Stability ratings of 85% on outriggers and 75% on tyres are PCSA-derived structural safety factors against tipping, and they are not optional margins a rigger can decide to ignore [S5]. For a more general spec-level comparison of how lifting vehicle families differ in chassis, outrigger, and boom design, the SourceBySpec encyclopedia covers the cross-vendor trade-offs that the chart alone does not show. A pre-lift cross-check using the OEM chart, a measured radius, and a deducted net-capacity figure is the only combination that satisfies both the OEM's stability rating and a defensible method-of-lifting record [S2][S3][S5].
See also our earlier report, Tower Crane Type Selection by Site Constraints and Lift Requirements.