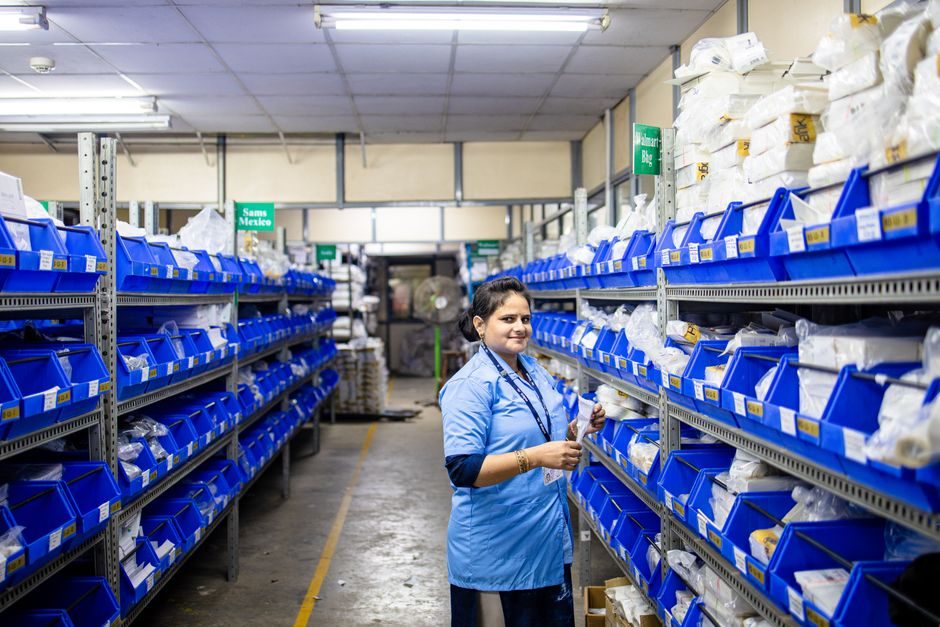
Global UPS demand reached USD 19.32 billion in 2026 and is forecast to reach USD 27.68 billion by 2035 at a 5.4% CAGR, while a parallel tracker pegs the market at USD 11.5 billion in 2026 growing to USD 14.91 billion by 2030 at 7.4% CAGR [S2][S3]. The wider funnel and the narrower tracker disagree on the absolute base, but both point in the same direction: capacity additions, not demand, are the binding constraint on delivery through 2026.
Two structural forces collide on the supply side. First, hyperscale data-center commissioning has pulled >100 kVA three-phase industrial UPS frames forward into 2026 delivery slots that transformer and IGBT vendors are already over-committed on. Second, 54% of new UPS demand is shifting toward lithium-ion battery cabinets, a supply chain still dominated by a few cell makers, and 68% of data-center operators now specifically prefer that chemistry over VRLA [S2]. When two constrained queues are joined end-to-end, the bottleneck is whichever queue is shorter — and right now, both are.
Where the Bottleneck Actually Sits: Cells, Transformers, and the IGBT Stack
The classic mistake on a 2026 UPS shortage is to blame the cabinet integrator. The cabinet is sheet metal, fans, and a static bypass switch — none of those are scarce. The binding parts are upstream: LFP prismatic cells in 100 Ah and larger formats, MV/LV distribution transformers rated for the inverter's kVA, and IGBT modules for the rectifier/inverter pair [S2][S3]. A switching power supply front end inside the rectifier and a DC power supply intermediate bus do not change that dependency; the same cell and transformer queues feed them.
On capacity segmentation, units below 10 kVA hold the largest share at 33% in 2026, driven by residential, SME, and small-office buyers responding to grid instability, while the >100 kVA tier is the one actually supply-rationed because each unit pulls one transformer and one battery cabinet that take months to source [S4]. A separate cut places the <10 kVA band at 58% by unit volume with 42% adoption in emerging markets, reinforcing that mass-market UPS is plentiful in finished goods but tight in the cells feeding it [S2].
Three Topology Choices and Their 2026 Risk Profile
Online double-conversion, line-interactive, and off-line/standby are the three product families, and their supply risk is not symmetric [S3]. Online conversion dominates data-center and industrial loads because it continuously rectifies AC to DC and back to AC, isolating the load from grid disturbances — but every online unit consumes a full-rated rectifier, inverter, and static bypass, so the bill-of-materials is the largest and the lead time the longest. Line-interactive sits in the middle on protection and on BoM, and is the typical 10–100 kVA choice for commercial floors. Off-line/standby only switches in on outage, so the inverter and battery are sized for ride-through rather than continuous duty, and that smaller bill-of-materials is what makes standby the largest single topology by unit count in unstable-grid regions [S3][S4].
For 2026 sourcing the comparison reads: online double-conversion has the strongest protection but the longest lead time and the highest capex; line-interactive is the cost-balanced default for 10–100 kVA commercial; standby is the fastest to ship but is a poor fit for any load that cannot tolerate a 4–10 ms transfer [S3]. Choosing standby to dodge a 2026 delivery slot is a real trade buyers are making, but it is a protection trade, not a free lunch.
Acceptance and Field Risk: Where Bad UPS Programs Are Born
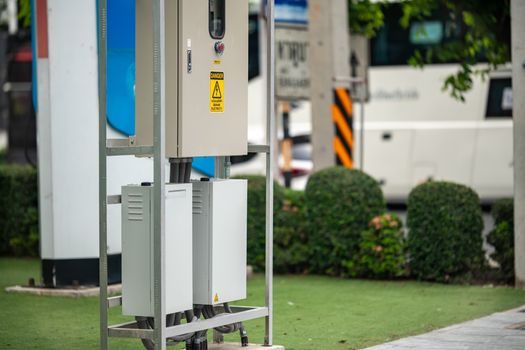
The installation-checklist layer is where most 2026 field failures actually originate, and it is independent of the supply crunch. A site handover that skips battery self-test report review, paralleling verification, or maintenance-bypass interlock checks will fail under the first real outage, regardless of how the unit was sourced [S1]. Eighteen documented acceptance items run from unboxing reconciliation through ground-bond verification, DC switch installation, parallel-output and maintenance-bypass interlock test, and final debris cleanup [S1].
On the input side, supply parameters — voltage, frequency, phase sequence — must be measured against design values before energising, because reverse phase sequence is a silent killer of three-phase rectifier fans and is not visible on a panel meter until the unit trips [S1]. Battery monitoring system data must also be sanity-checked against a hand-held voltmeter; BMS drift of even a few percent on a 480 V string will either mask a failed cell or false-alarm a healthy one, and either error corrodes operator trust in the monitoring system itself [S1].
Who Should Hedge Now and Who Can Wait
Operators commissioning new data-center halls, edge micro-sites above the 10 kVA line, or any industrial process with a documented ride-through requirement should treat 2026 UPS lead times as a planning input, not a procurement surprise. A separate supply-side map for adjacent power-and-cooling kit — for example the liquid cooling supply squeeze running in parallel this year and the immersion cooling fluid and PSU retrofit pressure — confirms that 2026 is a power-and-cooling constrained build cycle, not a one-component blip. Operators with stable grid, <10 kVA standby loads, and no ride-through obligation can rely on the 33% share <10 kVA band and standard distributor stock [S4].
Standards and Sourcing Anchors Worth Naming
Two anchors are worth holding onto when a UPS shortage tempts shortcuts. The first is the field-acceptance discipline codified in installation checklists: every parallel-output switch, maintenance-bypass interlock, and battery monitoring channel must be evidenced, not assumed [S1]. The second is the topology decision itself: a standby unit chosen to dodge a 2026 delivery slot must still meet the load's transfer-time requirement, and if it cannot, the right answer is to slip the schedule, not to downgrade the topology [S3][S4].
One verifiable next signal to watch is regional share movement: Asia-Pacific already leads with 43% of the global UPS market, North America holds 29%, and Europe 21% [S2]. A measurable shift in those splits through the 2026 delivery year — particularly any acceleration of Asia-Pacific share as new cell and transformer capacity comes online there — will be the cleanest single indicator that the bottleneck is breaking. A second signal is the lithium-ion adoption curve itself: 54% preference shift and 68% data-center demand are the 2026 baseline numbers; if either moves sharply, the cell-queue bottleneck will move with it [S2].