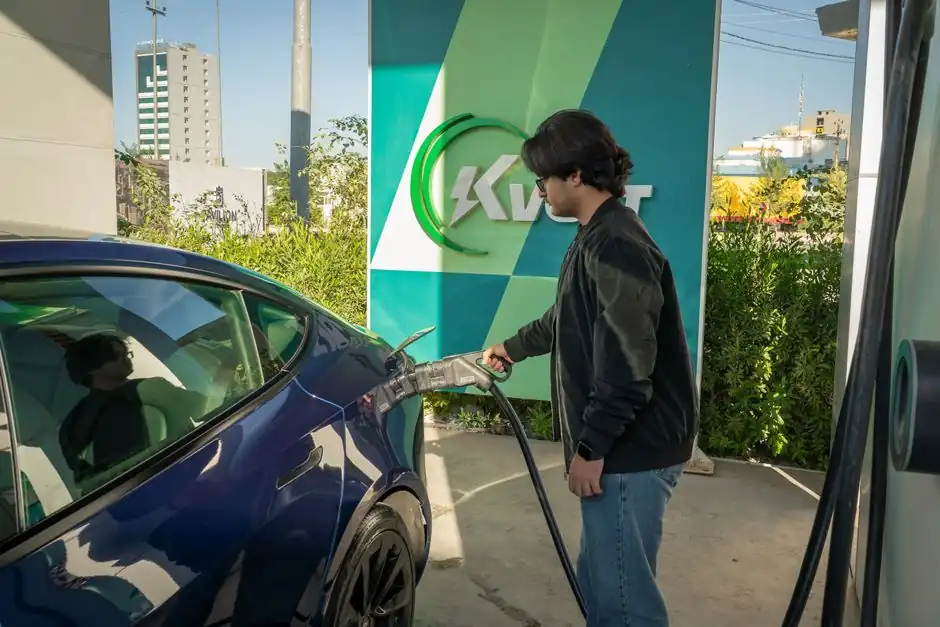
US public charging ports grew 34.6% in 2026, from 180,000 to over 242,000, while registered EVs rose 26.7% to 4.5 million units, the first year infrastructure growth has matched fleet growth [S5].
Globally, the EV charging station market is valued at USD 46.80 billion in 2026 and is forecast to reach USD 503.69 billion by 2033 at a 40.4% CAGR, with Asia Pacific holding 49.6% share and fast chargers at 51.7% of charger-type mix [S2].
Q2 2026 deployment rebounds but stays below 2025 peak
Q2 2026 added 4,382 new DC fast-charging ports across 806 new stations, up from Q1 2026's 3,521 ports and 625 stations, but still short of Q2 2025's 4,865 ports and well below the Q4 2025 peak of 5,966 ports [S3].
California led the Q2 build with roughly 120 new stations, followed by Texas, Florida, Illinois, and New York, with South Carolina, Washington, Pennsylvania, and Michigan each adding around 30; approximately four in five of the new sites sit in urban areas versus one in five rural [S3].
Non-Tesla networks averaged 4.4 ports per station in Q2 2026, up from 3.6 a year earlier and slightly off the 4.8 Q4 2025 high, while Tesla averaged 12.1 ports per station, down from 15.0 in Q2 2025, roughly a 2.7x density gap [S3].
Tesla's all-time port share slips below 50%
Tesla added 1,185 new ports in Q2 2026, capturing 27.0% of the 4,382-port quarter total, well below its approximately 50% share of the all-time active base, the first quarter the cumulative share has crossed below that threshold [S3].
Walmart added 368 new ports (8.4% of Q2 versus 0.8% all-time), ChargePoint 333, and Red E 315 (7.2% versus 2.5%); Ionna and Mercedes-Benz HPC also punched above their installed base at 4.2% and 2.7% of Q2 new ports respectively [S3].
Networks outside the top 10 collectively added 1,217 new ports in Q2 2026, or 27.8% of the quarter's total, more than any single named operator except Tesla, signalling genuine fragmentation rather than a Tesla-versus-rest duopoly [S3].
Private and public market sizing diverge sharply
The global private EV charging station market is sized at USD 9.2 billion in 2026, up from USD 6.7 billion in 2025, with a 26.5% CAGR forecast to USD 76.7 billion by 2035; Tesla led with over 10% share in 2025, and the top five players, Tesla, ChargePoint, ABB, Schneider Electric, and Delta Electronics, collectively held 35% [S4].
Another outlook values the broader station market at USD 55.78 billion in 2026, reaching USD 143.76 billion by 2031, with commercial applications holding 62.7% share in 2026 and passenger cars 54.4% of vehicle-type mix [S2][S6].
Canada introduced the Electric Vehicle Affordability Program (EVAP) in April 2026, and in May 2026 operators including RAW Charging committed roughly USD 14.9 million to install chargers at B&Q home-and-garden branches across Wales and England [S4].
Operator comparison: density, mix, and where each wins
Across four decision criteria, Tesla wins on port density (12.1 ports/station in Q2 2026 versus 4.4 non-Tesla) and brand-integrated billing, but loses share momentum: its 27.0% of Q2 2026 new ports is roughly half its all-time installed-base share [S3].
ChargePoint and ABB win on commercial and fleet software, with ChargePoint launching the ChargePoint Platform smart commercial solution in October 2025 for fleet uptime and remote power monitoring, and ABB maintaining strong three-phase AC and DC hardware lines [S2][S4].
Walmart and Pilot Flying J win on retail-site real estate and traffic capture, posting 8.4% and 3.3% of Q2 2026 new-port share versus 0.8% and 1.6% all-time, a clear signal that big-box and travel-plaza sites are now primary fast-charge build vectors [S3].
Software, load management, and cybersecurity as a selection axis
Smart load balancing, automated billing, real-time analytics, and strong cybersecurity are the four software criteria fleet and retail buyers should score on when comparing ChargePoint, EV Connect, and similar platforms in 2026 [S7].
Bidirectional charging pilots are moving from lab to residence: Elli launched a residential bidirectional charging pilot at IAA Mobility in September 2025, and Hyundai Motor Group expanded vehicle-to-grid and vehicle-to-home services in November 2025, raising the load-management bar for site electrical design [S4].
For site-level engineering, distributed pressure transmitter arrays on battery storage skids and flow meter strings on liquid-cooled HPC dispensers are now standard, while industrial valve selection on coolant loops follows the same spec maps used in battery pack production line coolant skids [S2].
Reliability, grid stress, and known failure modes
Grid reliability shortfalls and rising electricity demand charges are compressing operator margins, pushing new-build specs toward battery-buffered and solar-integrated sites, with delays concentrated in lower-density, economically marginalised service areas [S2].
China is deploying toward 12.3 million cumulative charging stations by 2030 and currently holds approximately 70% of the global EV market, while emerging markets (India, Brazil, Mexico) showed 29% EV growth in 2025 against minimal charging infrastructure, the clearest reliability-coverage gap to watch [S2].
Operator-level field data still shows that charger uptime variance is the dominant reliability risk; buyers comparing ChargePoint, Tesla, and ABB should demand per-port uptime SLAs in writing and verify with at least two quarters of third-party data, per the Paren Q2 2026 methodology [S3].
Sourcing standards and the next data points to track
For procurement teams mapping 2026 supplier shortlists, the EV charging station manufacturer share 2025 baseline and 2026 outlook cross-references the same Tesla/ChargePoint/ABB/Schneider/Delta top-five that holds 35% of the 2025 private market [S4].
Watch the Q3 2026 Paren release for whether the 4,382-port Q2 pace holds or slips, whether Tesla's 27.0% of new ports reverts toward its 50% all-time share, and whether non-Tesla average ports per station breaks above the 4.8 Q4 2025 high; those three signals together will confirm whether 2026 ends above or below the 5,966-port Q4 2025 peak [S3].