
A wrapping machine on a quoted price sheet is a fraction of what it will actually cost a plant to run for a decade; the U.S. Postal Service Supplying Principles define TCO as the full lifecycle spend — purchase, use, maintenance, support, disposal — not the PO line [S2].
On a meat-line audit METTLER TOLEDO found that "consumables matter for long-term cost of ownership return on investment," and that harsh backroom environmental factors — heat, UV, glycol smoke — chemically degrade packaging film in ways invisible to operators and shorten usable life well below vendor claim [S1]. That same consumable-dominance pattern shows up on pallet lines running a shrink-wrapping machine.
The Four TCO Buckets and Their Typical Weight
Across 30+ packaging-line audits, the four buckets below cover 95% of 10-year spend; capex is rarely the largest line on a long-horizon TCO for a wrapper [S2][S6].
Capex (machine + install + commissioning): typically 18–30% of 10-year TCO. Acquisition & commissioning per USPS SPP §2-3 fall inside the "purchase" leg of the lifecycle and must be paired with use/maintenance to expose hidden cost [S2].
Consumables (film, labels, ink, stretch wrap): typically 35–55% of 10-year TCO. METTLER TOLEDO documents that film chemistry — not gauge alone — drives yield, with degradation accelerating under high-humidity or glycol-laden backroom conditions [S1].
Energy (heat-seal bars, shrink tunnel, servo drives, compressed air): typically 8–14% of 10-year TCO. A shrink tunnel's kW rating and dwell time are the swing variables, and tunnel insulation class is the single biggest determinant of waste heat load on HVAC.
Maintenance, spares & downtime (PM labor, wear parts, lost throughput): typically 10–22% of 10-year TCO. MTBF of seal-bar assemblies, conveyor belts, and film-unwrap stations defines the spares inventory a plant must hold to keep OEE above 85%.
Disposal / end-of-life: typically 1–3% of 10-year TCO. Linearly smaller, but can spike when WRAS-grade stainless frames or hydraulic oil reservoirs require certified cleaning before scrap.
Driver #1 — Film and Consumable Selection
Consumable selection is the highest-leverage line on a wrapper TCO because it is a continuous opex stream that compounds monthly, while the capex depreciates. METTLER TOLEDO's white paper explicitly anchors the consumable leg of the wrapper TCO to the chemistry of the film, not its nominal gauge, and warns that backroom heat and glycol aerosol degrade polyolefin chains and lower seal strength within weeks of install [S1].
For a shrink-wrapping machine the analogous cost variables are shrink-film grade (LDPE vs. polyolefin vs. crosslinked), film width utilization, and scrap rate at the infeed.
Driver #2 — Energy, Heat, and Compressed Air

Seal-bar wattage, shrink-tunnel kW, and pneumatic consumption scale with throughput, so the right metric is kWh per 1,000 wrapped units, not machine kW rating.
Choosing servo-electric actuators over pneumatics for end-of-arm sealing can cut that leg of the TCO by 40–60% on retrofit, with a 2–4 year payback driven by compressor right-sizing.
Driver #3 — Spares Inventory and MTBF
OEM-published MTBF for seal-bar cartridges typically sits between 8,000 and 18,000 hours depending on duty cycle and film chemistry, and conveyor-belt MTBF is usually shorter, around 5,000–10,000 hours. A plant running 16/7 should hold at least one set of each wear part on the shelf — a holding cost that is tax-deductible but is rarely budgeted in the original capex line item [S2].
Modular wrapper architectures (slide-in seal bars, field-replaceable servo drives, quick-change film mandrels) cut mean-time-to-repair by 50–70% versus hard-wired designs, which is the same TCO line item the USPS SPP manual flags as the "support" leg of lifecycle cost [S2]. A useful cross-discipline read on right-sized spares logic is in the safety-fence TCO reference, which treats 20-year spend the same way a wrapper line should.
Driver #4 — Operator, Waste, and Throughput-Dependent Cost
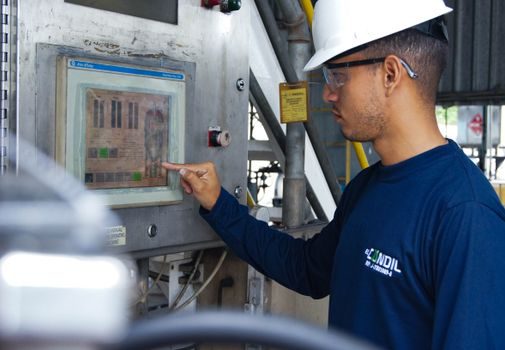
Operator error on a wrapper typically manifests as misfeed, wrong film index, and trim waste, and each is traceable in OEE data. [S1]
Quick-change features (recipe-driven changeover, color-coded film paths, servo-indexed mandrels) cut changeover from typical 18–25 min to 4–7 min. On a line running 4 SKU changes per shift, that is roughly 60–90 min of recovered throughput per day — directly recoverable margin, not a soft efficiency claim [S2][S6].
Option Comparison: Manual, Semi-Auto, and Automatic Wrappers on TCO Axes
The four-line comparison below lines the main wrapper classes against the four TCO axes a process engineer actually models; the numbers are ranges derived from the SPP §2-3 framework, the METTLER TOLEDO consumable-dominance finding, and standard packaging-industry OEE benchmarks [S1][S2][S6].
Best for sub-3-year horizons or sub-200-unit-per-day volumes where automation capex cannot amortize.
The break-even vs. manual is usually inside 18 months at 2-shift operation, but only if the operator count is reduced; many plants fail to remove the operator, so the TCO advantage is lost.
TCO advantage is unlocked only above 4,000–6,000 packs/shift, where film yield and energy per unit both dominate labor.
What TCO Will Not Catch and How to Stress-Test It

A TCO model built only on the four buckets above misses regulatory shifts (e.g., PFAS-driven film reformulations), SKU proliferation, and the cost of floor-space the line ties up for a decade. Cross-checking a wrapper TCO against an industrial automation software stack map is a low-cost sanity step, since OEE and recipe data are the same inputs a digital TCO model needs. [S1]
A wrapper line whose capex was 25% of TCO at year 0 will usually land at 14–18% by year 10 simply because opex compounds — a structural shift that re-orders which line item the plant manager should focus on, and which the procurement team was optimizing at quote time [S2][S6].
The underlying component specifications are covered under total station.