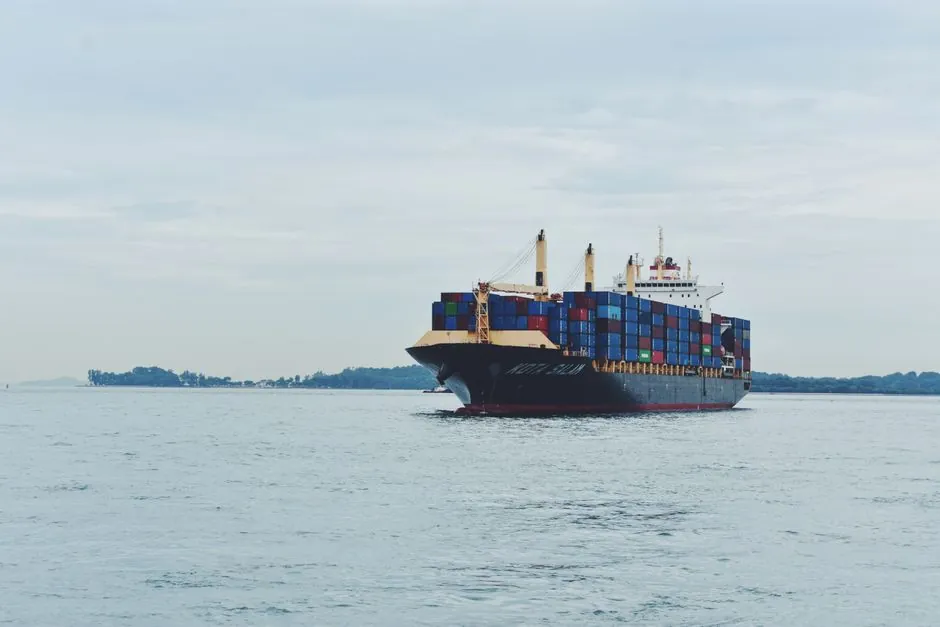
Global containership orderbook capacity stood at approximately 13.1 million TEU against an active fleet of about 33.8 million TEU as of mid-2026, producing an orderbook-to-fleet ratio of 38.7% [S3]. Linerlytica, the shipping consultancy that first flagged the milestone, recorded a 39% ratio with a 1,630-vessel backlog totalling 13.28 million TEU in June 2026 [S1][S5]. The level is the highest since the post-2010 era and is closing in on the 50%+ ratio last seen around the 2008 financial crisis [S1].
By ship size, the orderbook is heavily skewed to mainliners. Vessels of 7,600 TEU and above carried a 49% orderbook-to-fleet ratio in Q1 2026 according to Maritime Strategies International, versus 16% for mid-size ships of 3,900-7,600 TEU and 17% for smaller feeders [S1]. Global Ship Lease's 30 June 2026 cut shows 55.2% of the orderbook concentrated in ships of 10,000 TEU and above, with only 24.7% in the sub-fleet categories [S3].
Orderbook tonnage and the 40% threshold
Three independent datasets triangulate the headline figure. Linerlytica counted 13.28 million TEU on order in 1,630 ships, putting the orderbook-to-fleet ratio at 39% in June 2026 [S1][S5]. Global Ship Lease's mid-year assessment gave 39.1% using Maritime Strategies International data as of 30 June 2026 [S3]. Clarksons Securities reported 31.6% at an earlier cut in May 2026, up from 27.5% at the start of 2023, a more conservative denominator that includes different fleet definitions [S7].
The ratio has climbed fast: 31.7% in August 2025, then 39% by mid-2026, a near-eight-point swing in under 12 months [S1]. The aggregate 9.6-10.4 million TEU tallies recorded a year earlier by Global Maritime Hub and Linerlytica captured only the first wave of the 2025-2026 contracting binge [S4][S8]. The 2026 increase is mechanically driven by 332 newbuild orders placed in the first five months of the year, putting the full year on track to approach 2025's record 750-ship haul, per Clarksons Research [S5].
Segment comparison: mainliner, mid-size, feeder
Three sub-segments behave very differently and should be read separately, not aggregated, when sizing capacity risk for a 2026-2030 trade lane. Per Maritime Strategies International and Global Ship Lease figures cited above [S1][S3]:
For procurement or chartering teams sizing exposure, the practical read is that the arterial Asia-Europe and trans-Pacific trade lanes face the highest near-term capacity additions, while regional feeder and intermediate networks remain relatively tight. The 1,000-2,000 TEU feeder segment even absorbed 31.5% of Q2 2026 ordering activity, with charter markets for modern feeder tonnage described as scarce by MPC Container Ships [S3].
Shipyard distribution and alternative-fuel mix
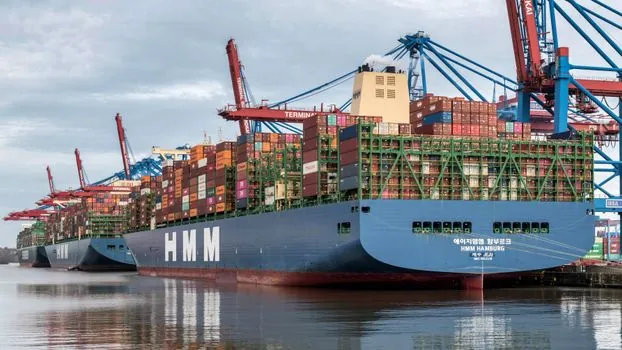
Chinese yards captured most Q2 2026 contracts, while South Korean yards landed only 10 orders in the same period [S3]. Inside China, the build is migrating down the yard ranking. Tier-one Chinese yards are booked through end-2028, and the Linerlytica-classified Tier-2 cohort now holds roughly 25% of the orderbook by vessel count [S1]. Shandong Huanghai Shipbuilding and Taizhou Sanfu top the Tier-2 rankings with a combined 110-vessel backlog, and Taizhou Sanfu recently booked ten 6,200 TEU ships for Global Ship Lease on 2028-2030 deliveries [S1]. Hengli Heavy Industry, the successor to STX Dalian in operation since January 2023, would see its container backlog exceed 60 vessels if its rumoured CMA CGM 6,000 TEU series (six to eight ships) confirms as the first major 2026 European newbuilding order [S1].
Alternative-fuel propulsion complicates the headline tonnage. One industry estimate pegs LNG-, methanol- or otherwise alternative-fuel-capable ships at approximately 65% of the existing orderbook by TEU capacity [S3]. Clarksons data via MPC, however, shows that most Q2 2026 orders themselves were conventionally fuelled, indicating that the alternative-fuel share is being driven by the 2024-2025 contracting wave, not the most recent orders [S3]. Linerlytica's earlier data point of 5.4 million TEU scheduled for 2028 delivery (a record) sits on top of this mix, with slots still open at selected Tier-2 facilities [S1].
Demand-supply math and the diversion variable
Supply growth is set to outrun demand growth. Container trade in 2026 is tracking roughly 3-4% growth, against full-year fleet capacity growth of about 4.2% and an orderbook implying even steeper additions in 2027-2029 as deliveries accelerate [S3]. Alphaliner has flagged 2029 as the heaviest delivery year [S5].
The Red Sea diversion is currently absorbing the difference. Continued avoidance of the route has held more than 2 million TEUs of effective capacity per year since 2023, and a return to Suez routing could release capacity equivalent to roughly 12% more TEU-miles on its own per MPC estimates [S3]. Suez container traffic in January 2026 was the lowest January level in a decade at 150 crossings, with both December 2025 and January 2026 posting year-on-year declines even as some carriers redeployed rotations to the route [S2]. MSC Mediterranean Shipping, the carrier most exposed to swing capacity, now operates a fleet above 7.2 million TEU representing 21.4% of the global container ship fleet, with a further 2.18 million TEU on order, one of the highest orderbook-to-fleet ratios among the top ten carriers [S2].
Scrap-age discipline caps effective feeder growth
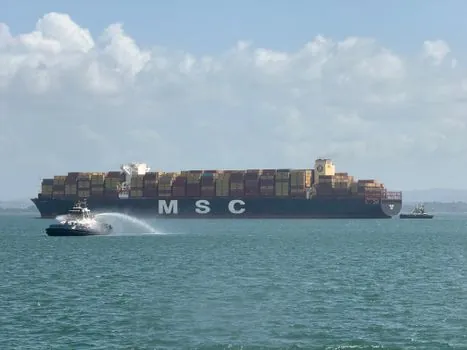
The feeder picture looks tighter than the 39% headline suggests, and the cap is demographic rather than ordering-driven. Global Ship Lease estimates the median age of the oldest 25% of vessels in several sub-10,000 TEU segments at 21-28 years [S3]. If all ships older than 25 years were scrapped through 2030, the implied net growth of the sub-10,000 TEU fleet over the period is only about 0.7% [S3]. That gives operators a structural lever: feed scrapping into delivery schedules to flatten effective supply.
Outside conventional ordering, Alphaliner is tracking at least two supramax bulk-carrier conversions to cellular container ships of around 2,500 TEU using Diamond 53 type open-hatch hulls built 2005-2011 by CSSC Chengxi Shipyard at Jiangyin, where the double-hulled, open-hatch design is described as among the more practical conversion candidates [S5]. On a small scale, this kind of conversion adds to the feeder and intermediate count without consuming newbuilding slots, a factor to watch for 2027-2028 regional capacity planning.
Carrier concentration and the LNG-propulsion track
The 1,630-ship orderbook is not evenly distributed across carriers, which shapes how much of the new tonnage can be absorbed in service. MSC's 7.2 million TEU fleet already controls 21.4% of global capacity, with 2.18 million TEU of additional capacity on order and a fleet of 980 vessels (727 owned at 4.55 million TEU, 253 chartered at 2.65 million TEU) [S2]. Yang Ming's first LNG-fuelled ship, the 15,600 TEU YM WILLPOWER from Hyundai Heavy Industries Ulsan, has entered service, the first of five Neo-Panamax LNG dual-fuel units ordered in 2023 and delivering through 2026-early 2027 [S2]. MSC's 90 active LNG-equipped vessels represent more than one-third of the global LNG-powered containership fleet, with CMA CGM second at 76 units [S2].
China-domestic small-yard and feedstock-side industrial capacity is the limiting factor for any carrier that wants to compress lead times; the 39% ratio itself is partially a yard-availability story, since Tier-1 capacity is sold out through end-2028, forcing recent contracts into the Tier-2 cluster with 2028 delivery slots [S1]. For B2B procurement teams tracking build slots or chartering future tonnage, the practical question is no longer whether the orderbook is large, but which sub-segments will deliver into tight markets, and which will land into overcapacity. Operators running scenarios should keep an eye on the next two data nodes: Clarksons Research's full-year 2026 contracting total (currently tracking toward 700-750 ships) and Linerlytica's mid-Q4 update on 2027 and 2028 delivery slippage from Chinese Tier-2 yards, both of which will refine the 39% figure and indicate whether the post-2010 high extends into 2027.
Detailed specification references: tank container, pressure transmitter, and flow meter.
Background reading: IEC 60947-5-2 switching distance: Sn, Sr, Sa and the 2019 edition delta.