Goldman Sachs now projects the AI server market reaches approximately $1.24 trillion by 2030, an 18% upward revision to its 4Q25 outlook of $961B for the 2026-2030 window [S1]. The same desk sees traditional non-AI servers crossing $160B over the same horizon, a figure that anchors the non-GPU portion of total server capex [S1].
Underneath that dollar number sits a power problem: Goldman Sachs Research forecasts global data center electricity demand rising 50% by 2027 and up to 165% by the end of the decade versus 2023, with AI's share of total data center power nearly doubling from 14% in 2023 to 27% in 2027 [S2]. Gartner's 2Q26 server forecast tracks the same direction, flagging memory pricing and AI server demand as the two forces reshaping spending patterns through 2030 [S3]. The build-out profile and its constraints are spelled out in our parallel piece on data center demand 2026-2030.
Forecast stack: Goldman vs. Gartner, both pointing up and to the right
Goldman Sachs' June 2026 update puts AI server TAM at ~$1.24T by 2030, with non-AI servers adding a further ~$160B+ for a combined server TAM north of $1.4T over the five-year window [S1]. The 18% lift versus the prior 4Q25 base reflects a re-rating of accelerator attach rates, not a change in unit shipment methodology [S1]. Gartner's 2Q26 Worldwide Server Forecast covers 2024-2030 and calls out the same two variables: AI server pull-through and memory price inflation, with the latter cascading into DRAM and HBM bill of materials on every high-end SKU [S3].
The two research houses are not identical in scope: Goldman's cut is an end-demand / capex-derived TAM for AI servers as a class, while Gartner's is a vendor-revenue server market tracker segmented by workload, with AI as a sub-line that crosses hyperscaler, neocloud, and enterprise on-prem [S1][S3]. For procurement teams, the practical question is attach mix; for boards, it is the slope of the curve. Both lines are positive through 2030 in the Goldman baseline [S1][S2].
Power as the binding constraint: 55 GW today, 84 GW by 2027
Goldman Sachs Research sizes current global data center power usage at approximately 55 GW, split across cloud computing at 54%, traditional workloads at 32%, and AI at 14% of consumption [S2]. By 2027 the same model puts total draw at 84 GW, with AI climbing to 27%, cloud dipping to 50%, and traditional workloads falling to 23% [S2]. That is roughly a 29 GW net add in four years, of which AI accounts for the majority of incremental gigawatts.
Muted-AI scenarios still leave a 71-75 GW floor; Goldman's sensitivity range between baseline and muted diverges by 9-13 GW, which is meaningful at the grid level but does not invalidate the build cycle [S2]. The 165% end-of-decade data point is the upper bound of the same trajectory, with AI workload power density per rack running materially higher than the legacy 7-10 kW average and pushing the need for liquid cooling and high-voltage distribution at the room level [S2]. A separate read on the supply side, including who is actually building, sits in data center demand 2026-2030.
Occupancy, cyclicality, and the 2026-2027 inflection

Global data center occupancy is projected to climb from around 85% in 2023 to a potential peak above 95% in late 2026, before moderating from 2027 as new supply comes online [S2]. Goldman flags a long-term oversupply risk from 2027 onward if efficiency gains capex-per-watt, with AI inference efficiency improvements acting as a partial offset to the training-driven demand spike [S2]. Hyperscalers and third-party wholesale operators together hold roughly 60% of the current ~59 GW of installed capacity, with the AI-dedicated campus a small but fast-growing subset owned predominantly by the same buyers [S2].
For instrument and equipment specifiers, the practical signal is the rack-level power and cooling envelope. High-density AI racks routinely exceed 30-40 kW and are pushing 100 kW+ in some liquid-cooled deployments, which changes the pressure transmitter and flow meter selection on the secondary coolant loop and the industrial valve class on the chilled-water branch. Standard pressure ratings for the secondary side typically step up to ANSI 300 or 600 with stainless or duplex wetted parts to handle the higher fluid temperatures and glycol mixes.
Comparison: AI servers vs. traditional servers, vs. the wider data center TAM
Three criteria line the two server classes up cleanly. First, revenue: AI servers dominate the dollar curve at ~$1.24T versus ~$160B for traditional by 2030, roughly an 8:1 ratio in the Goldman base [S1]. Second, power: AI workloads already consume 14% of data center electricity and are projected at 27% by 2027, against a declining share for traditional compute even as absolute traditional power grows [S2]. Third, supply tightness: hyperscaler occupancy peaks above 95% in late 2026 before easing, with AI-dedicated capacity growing off a near-zero base [S2].
On procurement risk, AI servers carry concentrated exposure to a small accelerator supply chain, while traditional servers are exposed to the broader DRAM and HDD pricing swings that Gartner flags in its 2Q26 update [S3]. On operating cost, AI server dollars-per-watt are higher, but the lifetime energy bill is what re-rates total cost of ownership; Goldman's 165% end-of-decade power figure is the variable that decides whether efficiency gains offset the AI training load [S2]. The three-market split behind the hardware side is laid out in server hardware demand 2026-2030: three markets, three forecasts.
Where the demand actually lands: accelerators, memory, and the upstream stack
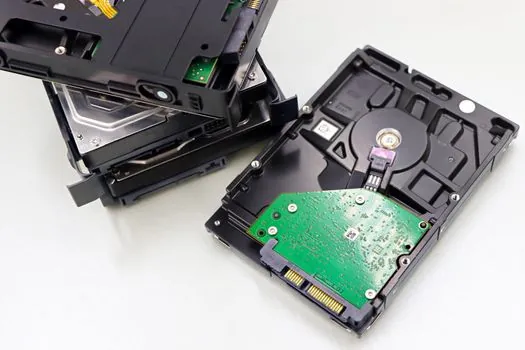
The dollar ramp has a specific component shape. AI server growth is led by accelerator attach and HBM stacking, with the 2Q26 Gartner outlook pointing to memory pricing as a parallel driver that re-prices both AI and traditional server BOM through 2030 [S3]. The accelerator side of that ramp is covered separately in AI chip demand 2026-2030, and the PCB and HDI substrate bottleneck behind it is profiled in PCB demand 2026-2030.
On the operations side, hyperscaler capex and the DRAM squeeze are reshaping the vendor map, with traditional ODM and tier-one OEM revenue mix shifting toward AI-rich SKUs [S1][S3]. The 50% power step-up by 2027 is the constraint that decides which sites can host new AI capacity, which in turn feeds back into regional server revenue allocation through the rest of the decade [S2].
Limits, failure modes, and what would change the call
Three things break the Goldman base case. First, a faster-than-modeled efficiency curve: if inference and training power-per-token drop materially, the 165% end-of-decade figure compresses and hyperscaler capex-per-watt falls, which would lower the AI server dollar TAM below $1.24T [S2]. Second, a deep-cycle oversupply from 2027 onward, which Goldman explicitly flags as a long-term risk that efficiency gains could actually worsen by lowering entry barriers for new capacity [S2]. Third, a memory price reversal, which would re-rate both AI and traditional server BOMs but cut the absolute dollar TAM that Gartner tracks in its 2Q26 update [S3].
A muted AI scenario still leaves data center power draw at 71-75 GW by 2027, versus the 84 GW baseline, so even the downside case does not unwind the build cycle, it only flattens the slope [S2]. For instrument specifiers working on the supporting plant, the unchanged elements are the high-density rack envelope, the liquid-cooling secondary loop, and the move to ANSI 300/600 pressure sensor and flow meter classes for the higher-temperature coolants. Standard candidates for the safety side remain ATEX/IECEx-rated instrumentation and IEC 60079 series compliance for any hydrogen or off-gas monitoring, with selection grounded in the actual zone classification rather than blanket adoption.
Signals worth tracking into 2027
Three numbers will tell whether the Goldman 18% lift and Gartner's 2Q26 memory call are tracking. First, the next revision to the 2026-2030 AI server TAM: any move above the $1.24T base by more than 5% would imply efficiency gains are not offsetting accelerator unit growth [S1]. Second, the 2027 data center power print: a reading near or above 84 GW validates the baseline, while a print below 75 GW signals the muted scenario is taking hold [S2]. Third, the HBM and DRAM contract pricing into 2H26, which is the variable Gartner identifies as the largest swing factor on server revenue through 2030 [S3].