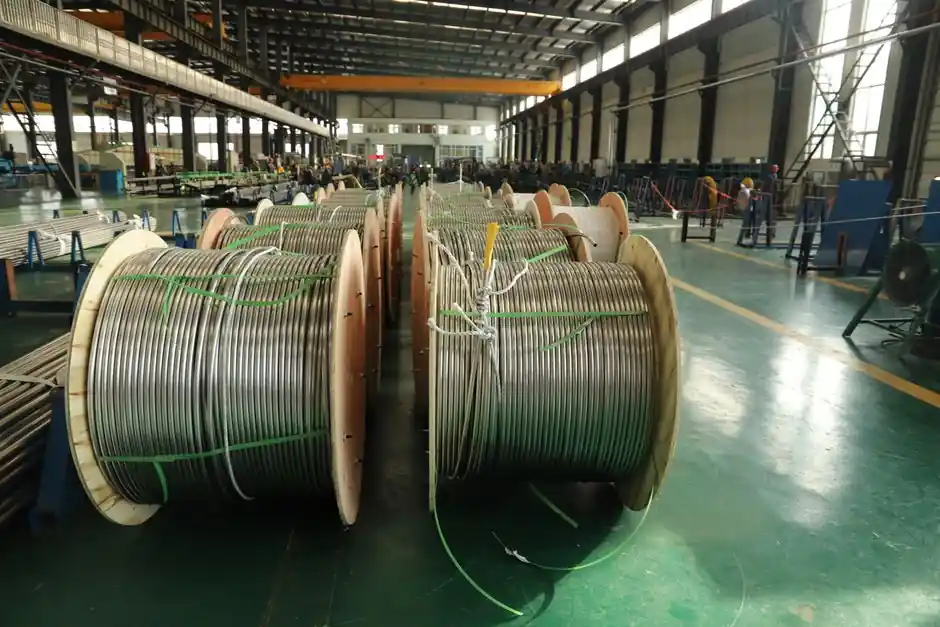
The 2025 industrial valve market is anchored by Emerson Electric Co. with over 12% revenue share, while the top five players, Emerson, Flowserve, SLB, KSB SE & Co. KGaA, and AVK Holdings, collectively control 42% of the market [S1]. Ball valves led the type segment at 37.10% share in 2025, and stainless steel dominated material selection at 45.05% [S3].
Asia Pacific is the largest regional market, holding 37.75% of 2025 valve revenue, with the Middle East forecast as the fastest-growing region at 7.19% CAGR through 2031 [S3]. Precedence Research places Asia Pacific at 36% share in 2025, with steel valves leading material demand and oil and gas leading the application segment [S5].
Top 5 Manufacturers and Concentration in 2025
Emerson Electric Co. led the industrial valve market with over 12% share in 2025, followed by Flowserve Corporation, SLB, KSB SE & Co. KGaA, and AVK Holdings, which together with Emerson held 42% combined market share [S1].
The leadership picture in industrial valve sourcing is shaped less by product count and more by qualification depth: a fugitive-emissions-certified refinery valve, a sterile bioprocess diaphragm valve, and a standard water-distribution butterfly valve face very different material, documentation, and service requirements [S1]. Concentrated supplier bases at the top of the market reflect the cost of maintaining that qualification matrix across global customers.
Market Size Estimates Diverge by Source
2026 market-size estimates vary materially across the research sources. Global Market Insights values the 2025 market at USD 73.9 billion and 2026 at USD 77.8 billion, with a 6.7% CAGR to USD 149.1 billion by 2035 [S1]. Mordor Intelligence gives a narrower valves-market frame at USD 90.06 billion in 2026, growing at 6.05% CAGR to USD 120.79 billion by 2031 [S3].
Future Market Insights places the 2026 market at USD 88.6 billion, projecting USD 134.8 billion by 2036 at 4.3% CAGR [S4]. Precedence Research reports the highest growth trajectory, valuing the market at USD 97.77 billion in 2026 and forecasting USD 273.49 billion by 2035 at 12.18% CAGR [S5]. Grand View Research sits at USD 83.1 billion for 2026, growing to USD 126.4 billion by 2033 [S9], and Market Research Future estimates USD 93.6 billion in 2026, reaching USD 155.5 billion by 2035 [S10].
Valve Type, Material, and Actuation Splits

Ball valves led the 2025 valves market by type with 37.10% share, while control valves are forecast to grow fastest at 6.65% CAGR through 2031 [S3]. Future Market Insights expects butterfly valves to lead type demand at 26.2% in 2026, driven by compact design and broad flow-control use cases [S4]. The divergence between ball-valve and butterfly-valve leadership signals the difference between broad valves-market tracking and narrower industrial-valve framing across research houses.
On material, stainless steel held 45.05% of the 2025 valves market, with cryogenic alloys forecast at 7.24% CAGR through 2031, the fastest material segment [S3]. Manual actuation retained 54.20% share in 2025, but smart electro-hydraulic systems are projected at 7.72% CAGR, the highest actuation growth rate [S3]. This is consistent with the broader industrial automation push: 46% of surveyed manufacturers were using Industrial IoT solutions at facility or network level, and 27% prioritized IIoT investments over the following 24 months [S1].
End-Use Segments and Demand Drivers
Oil and gas is the leading end-use segment, capturing 26.88% of the 2025 valves market, with hydrogen energy advancing at 6.88% CAGR toward 2031 [S3]. Over 80% of refineries worldwide use automated or semi-automated control valves for flow, pressure, and temperature regulation, and oil and gas operations consume nearly 30% of all industrial valves globally [S2].
Chemicals are projected at 35.4% of 2026 end-use demand in the Future Market Insights industrial-valve framing [S4]. Water and wastewater is a structural growth segment: utilities lose 25-30% of treated water annually to leakage, and Pennsylvania American Water programmed USD 586 million in upgrades for 2024-2026 alone, with Ontario approving CAD 970 million (USD 719 million) for municipal pipeline reinforcement [S3]. Mordor Intelligence's driver-impact table attributes +1.2% to CAGR from water and wastewater investment over the short term (under 2 years) [S3].
Regional and Country-Level Dynamics
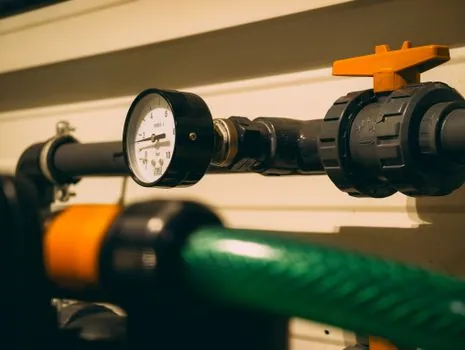
Asia Pacific's 37.75% 2025 share [S3] and 36% share in Precedence's 2025 reading [S5] reflect China's 27.7% share of global manufacturing output in 2024, with the US at 17.3%, followed by Japan, Germany, and India [S2]. China operated over 40% of global chemical capacity in 2024-25 and continues expanding LNG terminals and refineries, while India is adding 50+ city gas distribution networks and new water treatment plants [S2].
Saudi Arabia, the UAE, and Qatar together produce over 30% of global desalinated water, sustaining high-bore valve demand [S2]. The US and Canada manage 2.15 million km of pipelines, anchoring the largest installed base in North America [S2]. The Mordor driver model attributes +1.8% to CAGR from infrastructure-related developments, with APAC and the Middle East as core geographic beneficiaries over the 2-4 year medium term [S3].
Digitalization, Smart Valves, and the Automation Shift
Industrial automation penetration crossed 75% in large manufacturing facilities, accelerating demand for actuated and smart valves [S2]. More than 60% of new industrial projects now specify valves with low-emission packing or fire-safe certification, tightening the specification environment around emissions and safety [S2]. Mordor attributes +1.1% CAGR impact to industrial automation and smart valves, weighted to North America and the EU with APAC spillover, on a long-term (over 4 year) timeline [S3].
AI-embedded smart valves handle flow, temperature, and pressure conditions with real-time adjustment, replacing manual recalibration and supporting predictive maintenance, defect detection via vision systems, and inventory forecasting [S5]. The shift moves purchasing toward actuators, digital positioners, diagnostics, and lifecycle services rather than undifferentiated mechanical supply [S1]. This transition is reshaping the SCADA system industry shifts in 2026 integration layer as well, with valve diagnostics feeding cloud and edge architectures.
Comparison: Top Valve Manufacturers by Selection Criteria

Specifying between top valve suppliers comes down to four decision axes: qualification depth, geographic manufacturing footprint, smart-valve integration, and aftermarket service. Emerson leads on installed-base breadth and digital positioner integration across process industries [S1]. Flowserve and KSB SE & Co. KGaA hold strong positions in critical-service and standard process valves, with KSB's pump-valve portfolio often specified in power and water [S1]. SLB (formerly Schlumberger) carries upstream and midstream oil and gas weight, while AVK Holdings anchors water and gas distribution with strong municipal utility exposure [S1].
For chemical and process plants prioritizing butterfly valve and stainless steel solutions, FMI's analyst view flags integrated actuator and predictive monitoring capability as the next differentiation axis [S4]. For buyers comparing smart-valve roadmaps, Mordor's 7.72% CAGR projection for smart electro-hydraulic systems is the most concrete growth signal in the dataset [S3], aligning with the broader industrial catalysts 2026 automation pull across process plants.
Limitations and Watch-List for Buyers
Market-size estimates for 2026 span USD 77.8 billion (GMI) to USD 97.77 billion (Precedence), a 26% spread, and CAGR projections range from 4.3% to 12.18% [S1][S3][S4][S5]. This divergence reflects different scopes: some reports cover all valves including residential and HVAC-adjacent categories, while others restrict to industrial process valves. Spec-driven buyers should anchor on the type, material, and actuation splits rather than headline revenue alone.
Raw material price volatility remains a stated constraint on growth, particularly for stainless steel and cryogenic alloy lines [S2]. Hydrogen and modular-nuclear specifications are still in early-cycle mode, each contributing 0.6-0.9% to CAGR on a long-term (4+ year) timeline [S3], so qualification investment now is forward-looking rather than revenue-immediate. Global energy investment is expected to reach USD 3.3 trillion in 2025, with clean-energy technologies drawing USD 2.2 trillion, the macro anchor under the installed-base replacement cycle that sustains the top-5 supplier share through 2031 [S1].
Component reference pages worth checking: industrial adhesive, and industrial borescope.