
Beryllium supply concentration defines the risk profile: U.S., Kazakhstan, and China lead global production, with Materion Corporation operating the only fully integrated bertrandite-to-metal facility at its Utah mine and Ohio plants, controlling the transition from extraction to high-purity alloys and beryllium oxide ceramics [S2].
Aerospace and defense consumed nearly 40% of 2024 beryllium revenue (US$ 112 million), followed by industrial components (US$ 55 million), consumer electronics and telecom (US$ 50 million), and medical imaging (US$ 25 million) [S1]. The 2024 market reached US$ 281.65 million with a 7.22% CAGR projection to US$ 492.01 million by 2032 [S1], while a separate forecast values 2025 at US$ 237.3 million rising to US$ 298.34 million by 2030 at 4.68% CAGR [S2], and a third tracks 2025 at US$ 124.6 million growing to US$ 145.0 million by 2035 at 1.5% CAGR [S4].
Why the Supply Chain Stays Concentrated
Bertrandite ore runs at 0.2% to 0.5% beryllium content, an order of magnitude lower than beryl, yet remains the cost-effective feedstock for the U.S. integrated route [S2]. This mineralogical ceiling, combined with chronic beryllium disease (CBD) liabilities that force specialist ventilation and air monitoring on every precision machining shop, raises capital expenditure per new entrant to a level that has kept new primary supply off the market for decades [S2].
Resource scarcity is the upstream constraint: global beryllium resources are described as facing severe supply and demand challenges driven by ore scarcity and high geographic concentration of the deposits, which limits how quickly any single new project can offset a disruption at an existing mine [S3]. The midstream conversion step, beryllium hydroxide from ore, then feeds metal, beryllium-copper master alloy, and beryllium oxide ceramic lines, meaning a single chokepoint in hydroxide production can ripple into alloys, ceramics, and finished optics in parallel [S2].
Demand Drivers Across Aerospace and Electronics
Beryllium's modulus of elasticity runs roughly 50% higher than steel at a density below aluminum, which is why it ends up in places where stiffness-to-weight is non-negotiable [S2]. Low Earth Orbit (LEO) telecom constellations pull beryllium mirrors and optical housings for payload efficiency, 6th-generation fighter programs drive beryllium-aluminum composites for radar-transparent structure, and High-NA EUV lithography systems consume beryllium stages for zero-thermal-expansion behavior [S2].
By product form, beryllium-copper alloys dominated 2024 at over US$ 150 million for connectors, drilling tools, and aerospace components, pure beryllium metal reached US$ 70 million for satellite mirrors and lightweight structure, beryllium ceramics hit US$ 40 million for high-temperature and semiconductor use, and other forms (notably beryllium oxide) added US$ 21 million for nuclear and medical niches [S1]. In deep-water energy, high-pressure, high-temperature (HPHT) offshore wells keep pulling non-sparking, corrosion-resistant beryllium-copper drilling tools and subsea connectors, a demand line that does not soften with electronics cycles [S2].
Where Substitution and Recycling Bite
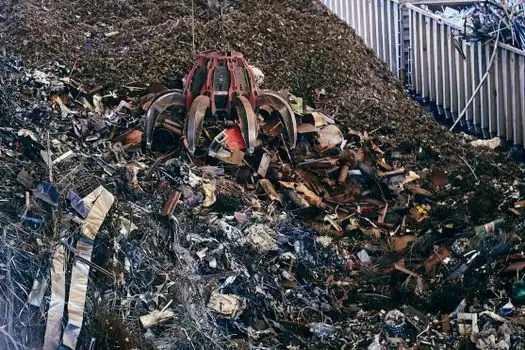
Substitution pressure is real but bounded: rising raw-material cost is pushing some consumer-electronics connector designs toward high-performance bronzes or stainless steels, but the substitution does not extend into applications that require beryllium's stiffness-to-weight, radiation transparency, or zero-thermal-expansion envelope [S2]. That carve-out keeps the aerospace and defense line structurally insulated from the consumer-side swap-out.
Recycling and secondary extraction are the practical relief valves: beryllium scrap holds high value and supports closed-loop aerospace supply chains, while processing advances now allow recovery of beryllium from industrial waste streams and low-grade tailings [S2]. On the policy side, the EU Critical Raw Materials Act (CRMA) and the U.S. Defense Production Act (DPA) are both being deployed to secure "strategic" mineral supply chains, and beryllium sits squarely inside that strategic list [S2].
Comparing the Three Major Forms Against Selection Criteria
For an engineer choosing a beryllium-bearing material, the form factor is the decision variable, not the element. A simple comparison lines them up against the four criteria that drive real specification calls: [S1]
Beryllium-copper alloy (US$ 150 million-plus in 2024 [S1]) wins on electrical conductivity, corrosion resistance, and formability, and is the default for connectors, automotive EV contacts, drilling tools, and oil-and-gas hardware [S1][S2]. Pure beryllium metal (US$ 70 million in 2024 [S1]) is the only option when you need the stiffness-to-weight ratio at the 50%-higher-than-steel modulus and density-below-aluminum envelope, which is why it owns satellite mirrors, optical stages for High-NA EUV, and lightweight aerospace structure [S1][S2]. Beryllium ceramics, including beryllium oxide (US$ 40 million plus US$ 21 million in adjacent forms in 2024 [S1]), are specified for high-temperature semiconductor and energy applications, plus nuclear and medical imaging windows where radiation transparency is the gating property [S1].
Standards, Health, and Compliance Overhead

Occupational exposure rules on airborne beryllium particles dictate how every shop that machines, grinds, or otherwise aerosols the metal is built and audited, and that compliance overhead is a non-trivial share of total cost of ownership for any new beryllium part [S2]. The same health regime is also why some consumer-electronics OEMs walk away from beryllium-copper and toward bronzes or stainless for non-critical connectors, accepting a small performance loss to avoid the ventilation and monitoring capex [S2].
On the trade side, supply is geographically split between the U.S. integrated route (Materion), Kazakhstan, and China, and that tri-polar concentration is the underlying reason CRMA and DPA policy levers keep attaching to beryllium, since no single alternative feedstock can be switched on inside a planning cycle [S1][S2]. For nuclear triggers, missile guidance, and stealth aircraft sensors, the strategic role remains essentially unmatched, which is why defense demand is described as structurally insulated from price cycles [S2].
Trackable Signals for the Next Six Months
Watch three signals: any CRMA or DPA funding announcements tied to beryllium recycling or secondary-extraction pilots, since these are the only credible near-term supply additions [S2]; any disclosure of beryllium-copper substitution in mainstream consumer connector lines, which would mark the substitution frontier advancing into higher-spec territory [S2]; and any new Materion capacity announcement covering hydroxide, master alloy, or beryllium oxide ceramic output, since each step has its own chokepoint inside the integrated value chain [S2]. For related industrial procurement context, see this overview of CE technical file requirements for machinery in 2026, and for adjacent mechanical-spec reading, torque-controlled vs displacement-controlled expansion anchors: mechanism and selection covers a different but spec-heavy decision tree.
For component-level specifications, see construction machinery and equipment, lamps and light fittings, and lighting equipment and electric lamps.