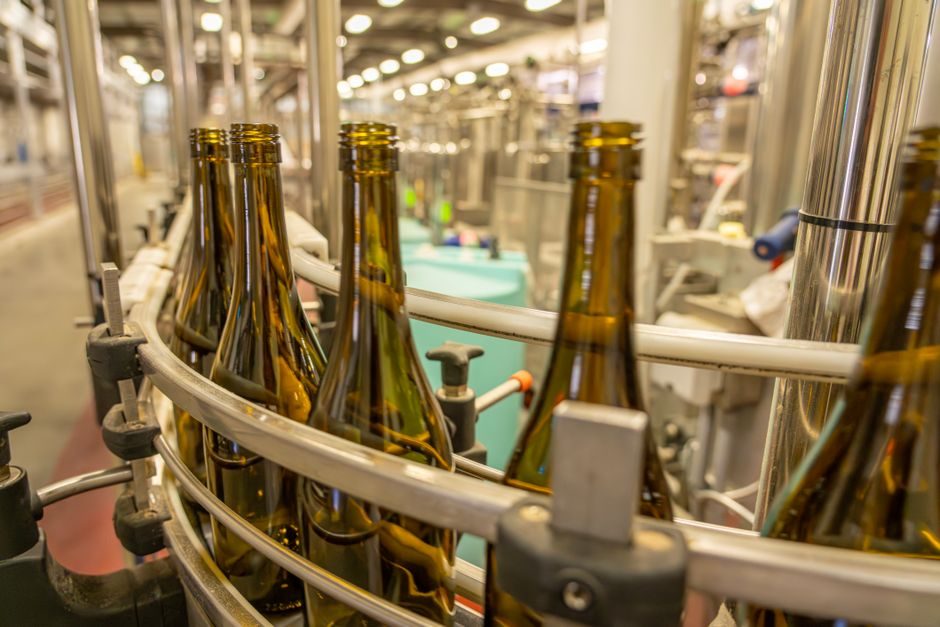
A 10-year total cost of ownership for a capping and sealing machine is dominated by unplanned downtime, changeover loss, and preventive spares rather than the purchase order value, and the US Postal Service Supplying Practices Process explicitly defines TCO as "the total cost incurred over the lifecycle of an item, encompassing purchase, use, maintenance, support, and disposal" [S7].
That lifecycle definition maps cleanly onto any capping and sealing machine line: one benchtop capper, one inline capper, and one high-speed rotary capper each hit the same TCO buckets but at very different unit economics, so a "lowest purchase price" award is almost always a false economy on a 10-year view.
Five TCO Buckets and Their Typical Share of a 10-Year Spend
The USPS SPP process lists the canonical TCO elements as purchase, use, maintenance, support, and disposal, and warns that "a TCO analysis exposes the hidden costs easily overlooked during budget planning or when making purchase decisions" [S7].
Purchase Price Tier Map and What Each Tier Actually Buys
Entry benchtop cappers typically price at the lowest tier of the catalog — single-head, hand-fed chuck or spindle drives, with throughput below 20 bottles per minute and no servo — and they are appropriate for pilot lines and lab use only. [S3]
Inline single-head cappers sit one tier up: 30–60 BPM, servo or torque-controlled chuck, often with a sealing washer integrity check, and they are the workhorse for short-run cosmetics, e-liquid, and small nutraceutical SKUs.
High-speed rotary cappers with 6–12 heads, integrated cap sorter/feeder, and torque verification push into the top tier and target throughputs above 200 BPM on still water, CSD, and edible-oil lines; this is where the absolute purchase price looks intimidating on a PO but unit cost per capped container is lowest by a wide margin [S7].
A spec-driven map for these three tiers — benchtop, inline single-head, and rotary multi-head — is laid out in Capping and Sealing Machine Types: Class, Drive, and Spec Map, which lines class, drive topology, and acceptance spec against the same three tiers.
Changeover, Tooling, and SKUs: The Hidden 15–25% Bucket
Changeover cost is the bucket most often missed at procurement stage because it is paid in operator hours, not capital, and the Capping & Sealing Machine Installation: Five-Gate Field Spec Map and Acceptance Criteria guide flags it as a first-day, on-floor problem rather than a PO line item. [S4]
Each cap-format change (28-400 ROPP to 38-400 ROPP, for example) on a non-modular inline capper can take 15–40 minutes of operator time plus 1–3 minutes of stabilisation; on a multi-format line running four SKUs that adds up to 60–120 minutes per shift, which at 60 BPM is the same as losing 3,600–7,200 bottles of throughput per day — a direct hit on revenue.
Spares, Wear Parts, and the [Capping & Sealing Machine] Spares Stack
The highest-frequency wear parts on any capper are the cap-sorting bowl friction inserts, the chuck liner/clutch jaw, the drive belt, the induction sealing coil LCR network, and the sealing washer — and the head drive servo if the machine is servo-driven.
pulp/wax vs. foil) for the cap material can double that bucket overnight.
Downtime Cost: The Single Largest Variable Across Plants

Unplanned downtime on a 60 BPM capping line running edible oil at a contract packer easily reaches $2–$5 per minute in lost contribution margin once labour, line allocation, and order-penalty exposure are loaded in — and a 2-hour stop per week, which is unremarkable, is $240–$600 per week or $12,500–$31,000 per year per line, dwarfing the maintenance budget. [S8]
Predictive maintenance on capping lines — vibration sensors on the cap-sort bowl, current monitoring on the chuck servo, and torque-trend monitoring on the sealing washer head — has been shown to cut reactive interventions materially, and the Springer IFIP paper on TCO-driven predictive maintenance notes that "the goal is to evaluate predictive maintenance implementation scenarios based on alternative condition monitoring (CM) solutions, under the lenses of Total Cost of Ownership (TCO)" [S1].
Sensors that fit cleanly into this predictive stack for capping/sealing lines are covered in Vibration Sensor Selection Criteria: Specs, Sensor Classes, and Duty-Cycle Match-Up, which lays out the duty-cycle matching for cap-sort bowl and chuck-head applications.
Energy, Utilities, and Disposal at End of Life
Compressed-air use, induction-coil kVA, and control-cabinet HVAC for a servo capping cell typically lands at 1.5–3.5 kW continuous for a single-head inline capper and 6–12 kW for a 6-head rotary; at 2026 industrial tariffs that is a low single-digit percentage of the 10-year TCO unless the line is in a high-cost grid region. [S1]
End-of-life disposal is a real line item on lines covered by extended producer responsibility (EPR) rules: induction-seal coil electronics, servo drives, and the HMI panel all carry WEEE recovery fees that range from 1–3% of original purchase price depending on jurisdiction, and they are commonly overlooked at TCO stage [S7].
Energy and disposal combined rarely exceed 10% of 10-year TCO on a capping cell — but they are the bucket where the gap between a poorly specified and a well-specified machine is narrowest, so over-engineering here is a sign of weak TCO discipline.
Options Comparison: Benchtop vs Inline vs Rotary Against Four Cost Criteria

Stacking the three main options — benchtop, inline single-head, and rotary multi-head — against four TCO decision criteria gives a structured view an engineer or AI can extract. [S1]
On purchase price per head, benchtop is the lowest absolute number, inline single-head is mid-tier, and rotary multi-head is 4–8× per head — but per capped container, rotary multi-head is lowest above 150 BPM, inline single-head is lowest in the 30–80 BPM band, and benchtop is never the lowest per-container number.
On changeover cost, benchtop leads because it is hand-fed and the format change is a manual part swap, inline is moderate and is where modular quick-release tooling pays back, and rotary is the most expensive to changeover in minutes but is least exposed to it on dedicated single-SKU lines.
On expected unplanned downtime, benchtop is the highest (operator-dependent), inline servo-driven is the lowest on properly specced lines, and rotary is in the middle when cap-feed and induction-seal subsystems are integrated [S1][S7].
Who a 10-Year TCO Model Is For — and Who It Is Not For
A 10-year TCO analysis on a capping and sealing machine is for any specifier or buyer running more than one shift, more than one SKU, or any line where downtime has a measurable margin cost — that is most production environments outside pilot labs. [S1]
It is not for a university lab or a contract R&D kitchen running one bottle per hour; for those buyers, a straight purchase-price comparison across two or three benchtop models is the right tool, and a TCO model would add ceremony without changing the answer.
It is also not for buyers who treat capital and operating budgets as separate silos with separate owners; if the operations team that pays the spares and downtime bills is not in the room when the PO is written, the TCO exercise will not change the outcome.
Verifiable Next Nodes and Trackable Signals
Trackable signal 1: ask the OEM for a 5-year mean time between failure (MTBF) figure on the chuck and induction-seal head, broken out by cap material — that single number governs the largest variable in the 10-year TCO. [S2]
Trackable signal 2: request a documented changeover time in minutes per format from the OEM on the exact cap family you run, and multiply by your own operator-loaded labour rate to convert that into a dollar figure before the PO is signed.
Trackable signal 3: insist on a 10-year spares price list with part numbers for at least chuck liner, clutch jaw, drive belt, sealing washer head, and the HMI panel — any OEM that cannot produce that list is signalling that their lifecycle support model is not engineered for the TCO the buyer is being asked to commit to [S7].
The underlying component specifications are covered under total station.