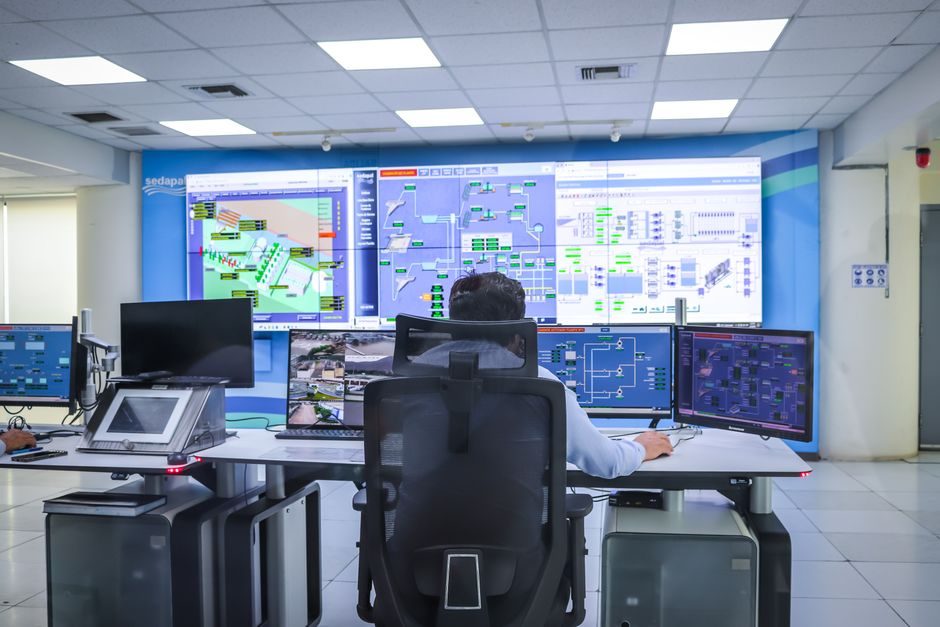
Data center capacity planning is the engineering process that sizes power, cooling, facilities, network, storage, and sustainability resources against the rack-, row-, and room-level demand of the IT load, with the explicit goal of avoiding both stranded capital from oversizing and lost revenue from undersizing [S1].
It is treated as continuous, not a one-time project: critical infrastructure, workload mix, and density assumptions shift every quarter, so DCIM (Data Center Infrastructure Management) platforms and standards-aligned audits (TIA-942, BICSI-002, Uptime Institute tier guidance) are run on a recurring cadence [S1]. For a process-engineering audience, the discipline is structurally identical to a plant's pressure transmitter and flow meter loop sizing exercise — define the worst-case duty, add margin, and prove it under all four stress axes.
Six Disciplines and the Sizing Cascade
Capacity planning in a hyperscale or colocation facility is built around six interconnected disciplines: power, cooling, facilities space, network, data storage, and sustainability [S1]. The cascade runs from IT load (kW per rack, IOPS per volume, Gbps per fabric) up to the room level: rack density sets row current, row current sets PDU (Power Distribution Unit) and busway sizing, room load sets chiller and UPS plant, and the building shell sets water and carbon budgets [S1].
Skipping a level is the most common failure mode — for example, specifying PLC rack I/O before the row-level breaker count is frozen, or commissioning chillers before the per-cabinet airflow is known. Uptime and TIA guidance treat the rack as the smallest billable unit; everything above the rack is a multiplier on that number [S1].
When Planning Fails: Oversize vs Undersize
Both failure modes carry material cost. The sunk cost is recovered only across a full refresh cycle, typically 10–15 years for a Tier III/IV hall.
Undersizing the same envelope is worse: it shows up as thermal tripping on GPU racks, brownouts under summer peak, and queueing on ingress fabrics — the failure profile mirrors what you see in an under-instrumented pressure sensor loop on a steam header. Sustainability metrics (PUE, WUE, green-energy ratio, embodied carbon) compound the cost when a stranded chiller plant must be re-permitted for higher ambient ratings [S1].
Options Comparison: Spreadsheet vs DCIM vs Automated Artifacts

Three delivery models dominate in 2026, and they line up cleanly against the four criteria that actually matter to a planning lead: auditability, lead time, error rate, and per-site CapEx. [S3]
The comparison that follows is derived from the Alibaba Apsara Stack and Device42 DCIM references; figures shown qualitatively reflect what those sources report about their respective workflows [S1][S3].
Manual spreadsheet models: best fit for a single brownfield hall under 500 kW, where the planning team can hold the entire bill of materials in one engineer's head. Auditability is high (one workbook, one reviewer), lead time runs 2–4 weeks per refresh, error rate climbs sharply past the second site, and per-site CapEx is near zero in software but absorbs senior engineering hours [S1].
DCIM platforms (Device42-class tooling): fit for the 500 kW to 5 MW multi-hall colocation and enterprise fleet. They keep an asset graph, drift-detect against rated capacity, and feed the data data logger stream that thermal and power alarms consume. Auditability is high because every reading is timestamped, lead time for a capacity refresh drops to hours, error rate is bounded by sensor calibration rather than by hand-keyed entries, and per-site CapEx is dominated by the DCIM license plus sensor retrofits [S1].
Artifact-driven automation (Apsara Stack model): fit for the cloud-vendor fleet where the same workload image is shipped to hundreds of customer data centers. The capacity plan is encoded as a deployable artifact, a unified model covers network, OS, and cloud products, and every change is validated in CI before it touches a live site. Auditability is enforced by the artifact's signed history, lead time per new site drops from "1–2 months of expert time" to hours, error rate is bounded by the test suite, and per-site CapEx collapses to the difference between brownfield commissioning and the same workload on standardized hardware [S3].
Alibaba's Artifact Pattern: A Worked Example
At SREcon Asia 2018, Xiaoxiang Jian of Alibaba described the Apsara Stack model that ships a single cloud offering into hundreds of vendor-built data centers: the planning artifacts capture the capacity, network, and product requirements end-to-end, a unified deploy model covers switches, hypervisors, and SaaS services, and configuration is kept in lightweight, version-controlled files rather than proprietary toolsets [S3].
The point of the model is that "1–2 months of expert time" per new site is replaced by an automated deploy that reuses the same artifact — capacity targets, cabling plans, and service manifests — and CI (Continuous Integration) tests validate every change before it propagates [S3]. Translated into a process-engineering vocabulary, this is the same shift the plant floor made when migrating loop tuning from individual DCS (Distributed Control System) stations to a typed, version-controlled library: the artifact becomes the contract between planning, build, and operations.
Storage and Backup Sub-Systems: A Capacity Caveat
Capacity planning is not only about megawatts. IBM's Spectrum Protect server guidance breaks the storage sub-system into three budgets that must be sized independently: database space, recovery log space, and shared resource area (SRA) for installation/upgrade rollback files [S2]. Each of the three has its own growth model — the database tracks the maximum number of files that can be held in server storage at one time, the recovery log tracks transaction volume, and the SRA tracks software-package size.
Skipping any one of the three creates a known failure mode: a database that fills because the rollback SRA was overlooked, or a recovery log that exhausts its volume because peak batch windows were not modeled. The same principle applies to the data logger on a process historian: storage, transient buffer, and archive each have their own SLO (Service Level Objective) [S2].
Standards Anchor and Sourcing
Recommendations in mature capacity plans are broken into three categories — facilities, electrical, and cooling — and are tied to TIA-942 (telecommunications infrastructure), BICSI-002 (data center design), and Uptime Institute tier guidance as the reference set, with sustainability tracked through PUE (Power Usage Effectiveness), WUE (Water Usage Effectiveness), green-energy ratio, carbon footprint, and water usage analysis [S1]. The same standards body of work is what lets a single capacity model be auditable across owner-operator, colocation, and hyperscale tenants.
Trackable signals to watch over the next two quarters: (1) the rate at which Uptime Institute and TIA publish refreshed tier/cooling-density guidance for direct-liquid-cooled GPU halls above 100 kW per rack, since that threshold already breaks the assumptions baked into many 2018-era capacity models [S1]; and (2) the migration of the Apsara-style artifact pipeline from cloud-vendor fleets into mainstream colocation RFPs (Request For Proposal), where DCIM today still dominates. Related reading: the broader Data Center Manufacturing Equipment Guide 2026 covers the upstream wafer-to-rack build chain, while Wind Turbine Production Line Design shows the same artifact-driven sim-first workflow applied to a different heavy-asset factory.