
A modern hyperscale data center bill of materials is dominated by server compute (CPU + GPU + HBM + mainboard + PSU), the leaf-spine switching fabric, and the mechanical-electrical-plumbing (MEP) layer, with embodied-carbon amortisation now sitting on top of every line item [S2][S3].
Procurement engineers who treat only the processor as the "system" under-estimate hardware embodied cost by as much as 7.5x in specific configurations, because the mainboard, DRAM, NIC, PSU and chassis each carry their own bill-of-materials and carbon weight [S2]. Re-casting the BOM as a whole-system view is the first correction needed before any cloud CapEx model balances.
Where the CapEx Actually Sits: Compute, Network, MEP, Land
The classic Cost-of-a-Cloud decomposition splits hyperscale CapEx into servers (~45-55%), the network fabric including top-of-rack and spine switches (~10-15%), the electrical infrastructure such as UPS, transformers, switchgear and PDUs (~15-20%), mechanical infrastructure including chillers, CRAH units and cooling distribution (~10-15%), and the building shell plus land (~5-10%) [S3]. These ratios are a planning reference, not a quote: the server share rises with GPU/HBM-heavy AI builds, while the MEP share swells in liquid-cooled or hot-aisle-contained halls.
The accelerators' "huge initial capital and ongoing repair and maintenance" cost is precisely the structural reason a new class of GPU-as-a-service vendors has emerged [S4].
Cost Drivers Inside the Server Block: Silicon, Substrate, Packaging, Test
Per-server cost is set by four nested drivers: silicon die cost (wafer cost × die area / yield), advanced packaging cost (CoWoS, SoIC, FOPLP for 2.5D/3D stacks), PCB and substrate cost (high-layer-count, low-loss materials), and final test/burn-in cost [S5]. The wafer-vs-packaging trade-off is the spec that matters most: a 28 nm vs 40 nm vs 65 nm decision is a real cost, risk and power trade-off, and the older node is not always cheaper once you fold in die area, leakage power and per-board area into the rack [S5].
Embodied cost is the silent multiplier: the same arXiv study [S2] shows that when you only model the processor and ignore the mainboard, DRAM, NIC, PSU and chassis, the resulting per-server carbon can be under-estimated by up to 7.5x. For a procurement officer, the rule is: model whole-system BOM, apply a depreciation schedule, and treat peripheral components as first-class cost lines, not as a percentage overhead.
Networking Fabric Cost: Radix, Bandwidth-per-Dollar, and Stranding Loss
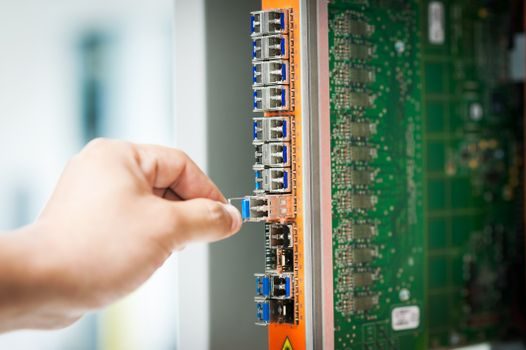
The fabric is the second-largest spend line, but its economics are governed by a separate ratio: useful work completed per dollar invested [S3]. Inside the rack, 400 GbE and 800 GbE leaf switches now dominate greenfield builds, and each speed jump roughly doubles the per-port silicon and optics cost while halving the per-bit cost — so the dollar decision is "buy ports you will light up," not "buy ports you might need."
The 2009 Cost-of-a-Cloud analysis flagged resource stranding and fragmentation as the dominant inefficiency in cloud data centers, with the same network hardware delivering very different dollars-per-flop depending on workload packing [S3].
Embodied vs Operational Cost: Why the Depreciation Window Matters
Manufacturing cost is paid up front, energy cost is paid monthly, and the depreciation window decides which one hurts more. The arXiv study [S2] models embodied carbon as a depreciating asset spread across the server's useful life, which directly changes the carbon-per-token profile of an inference service. A 3-year depreciation front-loads embodied cost and makes renewable-energy purchases more attractive; a 6-year depreciation dilutes embodied cost but assumes the hardware keeps its utilisation curve, which is rarely true for AI accelerators after the first generation.
Workload mix drives operational cost: a deep-learning inference workload with batch-size-1 traffic draws very different server-level watts than a training workload with batch-size-1024 gradient steps, so the same hardware can carry a 2-3x spread in operational cost depending on what you point it at [S2]. Treat the data center BOM and the workload schedule as a coupled system, not two separate cost lines.
Options Comparison: Hyperscale, Colocation, On-Prem, Edge, Modular
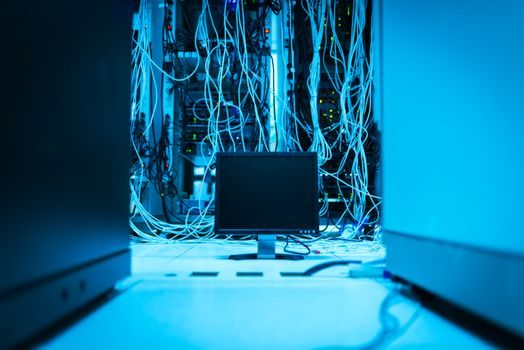
Four mainstream build models compete on the same cost axes. The numbers below are qualitative tiers derived from the research, not quoted prices — the published cost research [S2][S3] deliberately presents ratios and carbon factors, not list prices.
Hyperscale (owned, multi-tenant cloud): cheapest per-MW, longest procurement lead time, highest MEP share, strongest whole-system BOM control [S3]. Colocation: medium per-MW, faster time-to-power, customer pays separately for the rack and the network, embodied cost shared across tenants — useful when you need 1-5 MW fast. On-prem enterprise: highest per-MW in steady state, lowest idle overhead, fits where data-residency or latency floor is binding. Edge / micro-modular: very high per-kW but very low embodied stranding risk, best for sub-100 kW cabinets in 5G, CDN or industrial [S1][S3]. For a multi-site, multi-tenant rollout, the capacity-planning stack is the discipline set that turns these options into a defensible cost model.
Cost vs Performance Trade-off: GPU, FPGA, ASIC, CPU-Only
Workload type sets the accelerator choice and therefore the server-cost shape. CPU-only servers are the cheapest per-rack but the worst tokens-per-watt for matrix-heavy training, GPU servers sit in the middle on price and on top on throughput for deep learning training and inference, FPGAs win on latency-bound enterprise interfaces, and custom ASICs win on per-inference cost only at the largest hyperscale volumes [S4].
For build-quality and process discipline, the MOM/QMS/IIoT-loop spec stack defines the testing, yield and integration loops that decide whether a 28 nm vs 40 nm vs 65 nm ASIC choice [S5] actually delivers the cost and power trade it promised. Procurement should require factory-level yield and per-board test data, not aggregate "shipped" numbers, when a multi-million-dollar accelerator fleet is in scope.
Total Cost of Ownership: Power, Cooling, Real Estate, Software
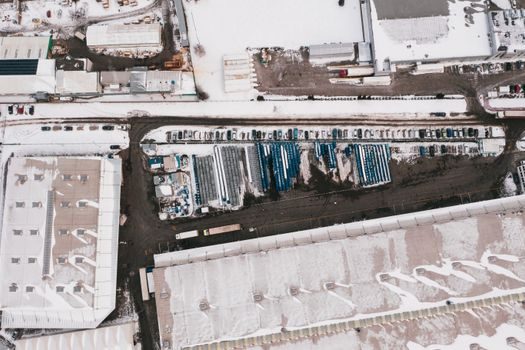
Purchase price is roughly 40-55% of 10-year TCO for a hyperscale build, with power, cooling, networking opex and operations staff eating the rest [S3]. Power cost is the largest opex line and the one that the embodied-carbon model [S2] interacts with most directly — over-provisioning renewable energy and shifting non-urgent batch jobs to peak-generation windows is a free TCO lever once the carbon scheduler is wired in [S2].
On the operations side, data-center management software for asset, power, and environment monitoring sits on the same physical layer as the flow-meter and pressure-sensor loops feeding chilled-water and leak-detection subsystems — so the choice of monitoring stack is not a separate budget line, it is part of the MEP cost line. For real-time capacity telemetry and the alerting layer that protects utilisation, a node-based licensed data-logger platform eliminates sensor sprawl and trims integration cost versus a per-sensor model [S1].
Sourcing, Standards, and Procurement Discipline
Standards that govern the data-center BOM sit at different layers: silicon-level reliability (JEDEC for HBM/DDR5, AEC-Q100 where automotive-grade GPUs are in scope), packaging-level (IPC-9701 thermal cycling, JEDEC J-STD-020 for moisture sensitivity), and system-level (TIA-942 for topology, Uptime Institute Tier I-IV for availability, ASHRAE TC 9.9 for thermal envelopes, ISO/IEC 30134 for KPI definitions including PUE and CUE). Embodied-carbon reporting is increasingly aligned with ISO 14067 and the GHG Protocol Scope 3 framing, with the additive-manufacturing-material supply chain beginning to influence spares and busbar production for the MEP layer. [S2]
Procurement discipline that survives an audit: require a whole-system BOM from the OEM (CPU + GPU + HBM + mainboard + NIC + PSU + chassis, not just the SKU), a depreciation window in writing, a workload-mix assumption in writing, and a separate line for embodied carbon amortisation [S2]. For full data-center build-quality process specs, the MOM/QMS/IIoT loops reference covers the test, trace and yield gates that catch under-spec mainboards and PCBs before they reach the rack.
Trackable signals in the next 90 days: accelerator vendor disclosures of 7.5x-style whole-system embodied-carbon multipliers, OEM moves to publish per-server depreciation curves rather than per-CPU curves, and the first tier-1 colocation operators publishing ISO/IEC 30134-aligned CUE alongside PUE. When those three signals move together, procurement models that only priced silicon will get re-rated.