
Global data center capex is being routed through a small cluster of integrators and component vendors, while the cooling, switching, and accelerator sub-markets each follow their own growth curve. Three segment-level data points anchor the picture: the data center cooling market is projected at USD 31.4 B in 2026 versus USD 26.3 B in 2025, tracking a 22.3% CAGR through 2033 [S3]; the data center accelerator market is sized at USD 170.81 B in 2025 and forecast to reach USD 372.68 B by 2030 at a 16.9% CAGR [S2]; and the worldwide Ethernet switch market closed 2024 at USD 41.8 B, with 4Q24 alone at USD 12.0 B, a 13.3% year-over-year jump driven by data center demand [S4].
Vendor share is not a single number. It has to be read by sub-segment, because cooling, switching, compute acceleration, and server form factors (rack, blade, modular) have different competitive structures, different regional concentrations, and different hyperscaler buying patterns.
Cooling: where 2026 capacity dollars are landing
The data center cooling market is forecast at USD 31.4 B in 2026, up from USD 26.3 B in 2025, on its way to USD 128.3 B by 2033, a 22.3% CAGR over 2026 to 2033 [S3]. Asia Pacific held 36.9% of 2025 revenue, the largest single regional share, reflecting hyperscale build-outs in China, India, and Southeast Asia. The growth is tied to liquid cooling adoption for AI racks and to retrofit demand from older air-cooled rooms that need density upgrades.
For buyers sizing a chilled-water or rear-door heat-exchanger loop, the right upstream instrument is a pressure transmitter on the chilled-water return, paired with a flow meter on the secondary loop, because cooling system PUE is bounded by the accuracy of these two measurements. Discrete component sourcing for cooling skids is global, so no single manufacturer dominates the share tables; OEM share is tracked by skid type (air, water, two-phase immersion) rather than by brand alone.
Compute accelerators: a top-5 oligopoly with disclosed revenue split
The accelerator segment is the most concentrated share picture in the data center stack. MarketsandMarkets lists NVIDIA, AMD, Intel, Alphabet, and Amazon Web Services as the top five vendors by revenue, with NVIDIA effectively anchoring the GPU tier [S2]. North America carried 47.0% of 2025 accelerator revenue, the highest regional share, while ASICs are projected to be the fastest-growing processor class at 29.2% CAGR through 2030 [S2].
The accelerator market is split along processor type: GPU, CPU, FPGA, and ASIC, with the GPU tier still the largest by dollar value in 2025, and the ASIC tier expanding fastest as hyperscalers push custom inference silicon. By type, cloud data centers dominate volume over enterprise data centers because of the AI training workload concentration. End-user verticals are IT and telecom, healthcare, energy, BFSI, government, automotive, and retail and e-commerce, with IT and telecom taking the largest share of accelerator spend through 2025 [S2].
Ethernet switching: 4Q24 print and who is named in the segment
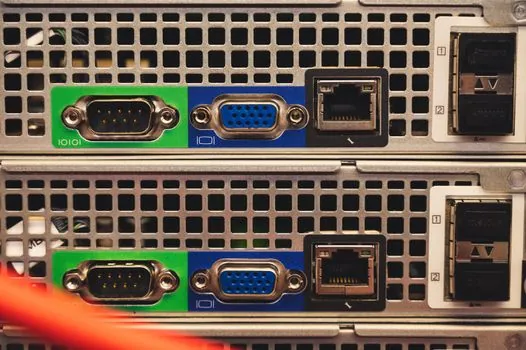
The worldwide Ethernet switch market posted USD 12.0 B in 4Q24 revenue, up 13.3% year-over-year, finishing the full year 2024 at USD 41.8 B, a 5.4% decline versus 2023 [S4]. The 4Q24 rebound is the cleanest data point on data center-led switching demand; IDC attributes the surge directly to data center buying. The enterprise and service provider router market is the adjacent track, at USD 13.3 B in 2024, down 19.1% year-over-year, which is a different buying pattern from the data center switch market.
On the fabric side, the named vendors in earlier market surveys include Arista Networks, Avaya, Brocade, Cisco, Dell, Extreme Networks, HP, Huawei, IBM, and Juniper, split across switching, routers, SAN, controllers, network security equipment, and management software types [S1]. The 2017-2023 forecast that drove that vendor list projected a 23.5% CAGR for the data center fabric market, with Asia Pacific (China in particular) taking the largest share gain and North America holding the second-largest absolute position [S1]. Vendor share inside this list is sensitive to hyperscaler design wins, where 400G and 800G migration is currently the binding constraint.
Server form factors: rack, blade, and modular split
Three server form factors carry different vendor maps. Rack servers are positioned as low initial cost and easy migration from tower installations, and they are gaining share as enterprises move beyond traditional tower servers to handle rapid workload changes [S9]. Blade servers are sold on density and reduced cabling, with the original pitch that a highly compact design cuts physical space and energy per unit of compute [S6]. Modular data centers are driven by capex reduction: pre-fabricated, containerized capacity that scales in chunks rather than in single-rack increments [S7].
Data center fabric networking vendors are positioning dynamic network infrastructure to consolidate applications and servers, virtualize system resources, and improve performance, availability, and energy efficiency, following an open-standards model [S8]. The fabric piece is what binds rack, blade, and modular form factors into a single design point, which is why the same switch vendors (Cisco, Arista, Juniper, Huawei, HPE) appear in both fabric and switching share tables.
Regional share and where capacity is being added

Asia Pacific is the largest regional share holder in 2025 cooling revenue at 36.9% [S3], while North America leads accelerator revenue at 47.0% in 2025 [S2]. The two numbers are not contradictory: North American hyperscalers buy the most accelerator silicon, while the physical cooling plant is being built out fastest in Asia Pacific. The data center fabric forecast from the 2017-2023 vintage already flagged Asia Pacific (China, India, Southeast Asia) as the fastest share-gaining region, with the United States holding the second-largest absolute position and Europe a meaningful third [S1].
For 2026 capex planning, this means the manufacturer share question is really three questions: who is supplying the silicon, who is supplying the switch fabric, and who is supplying the cooling plant. Each has its own vendor table and its own regional bias, and there is no single number that collapses all three. Buyers writing a 2026 spec should pull at least two sub-segment share numbers (for example, accelerator + cooling) and reconcile them against their region's hyperscaler build pipeline before locking the bill of materials.
Instrumentation layer: where the data center and industrial sensor markets overlap
The data center side and the industrial instrumentation side are converging on the same sensor stack, because hyperscale operators run their own utility loops and building automation. Differential pressure transmitter selections on chilled-water headers, pressure sensor arrays on CDU manifolds, and flow meter runs on cooling tower make-up lines are now spec'd the same way as on a chemical plant skid. A data logger is the standard bridge between the cooling plant PLC and the DCIM dashboard, and the PLC tier in modern data centers is functionally a building automation controller with IT-grade network interfaces. This is also where adjacent industrial supply chains, for example the pneumatic conveyor supplier map for chip fab build-outs or the distribution cabinet certification checklist for switchboard rooms, feed the same construction projects. [S1]
Trackable signals for the next reading: IDC's next quarterly Ethernet switch tracker print, which will refresh the 13.3% YoY 4Q24 figure into the 2025-2026 trend line [S4]; the cooling market's 2026 actual against the USD 31.4 B forecast [S3]; and the accelerator market's 2026 print against the USD 170.81 B 2025 base, which will show whether the 16.9% CAGR is holding or compressing as ASIC-class silicon takes share from merchant GPUs [S2].