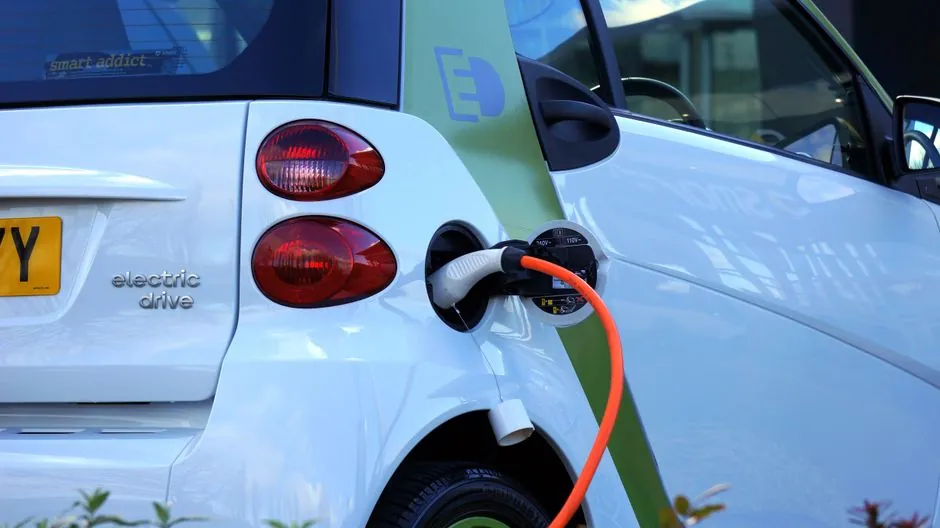
Tesla Supercharger network operated 36,877 public DC fast charging ports in the US as of April 1, 2026, giving it a 51.6% share of the national public DC fast port count, while adding nearly 1,200 new ports in Q1 2026 alone [S1].
Total US public DC fast charging ports reached 71,398 across 15,121 charging sites on the same date, with roughly 1.2% (883 ports) temporarily offline, and the top 10 networks together controlling about 85% of installed ports [S1]. Globally, DC charging stations held 77.95% of the EV charging station market revenue in 2025, projected to grow at a 53.10% CAGR through 2031 [S2].
US Port Counts: Top 10 Networks Hold 85% of DC Fast Ports
Public DC fast charging infrastructure in the US is being added at over 1,000 new stalls per month, with Q1 2026 contributing around 3,500 new stalls versus 2,700+ added in Q1 2025 [S1]. Average ports per site climbed from 4.1 to over 4.7 year-over-year, signalling larger-format highway and corridor sites rather than dispersed 2-stall builds [S1]. Behind Tesla, Electrify America was the next-largest named network at 5,610 ports (7.9% share) as of Q1 2026, with ChargePoint listed fourth despite not owning most of its hardware [S1].
More than two-thirds of Tesla Supercharger sites in North America now serve non-Tesla EVs, a structural opening that directly affects competitive share math for 2026 procurement cycles [S1]. Two independent data houses put the DC fast share of total charging-station revenue at 77.95% (Mordor Intelligence) and DC fast at approximately 42% of station unit revenue (Market Research Future), a gap that reflects whether the analyst weights ASPs and high-power hardware or counts per-port installations [S2][S6]. The DC-DC converter modules inside these chargers share selection logic with industrial power conversion; see the DC-DC converter selection guide for topology and ripple trade-offs that apply to 50–350 kW charging stacks.
Global OEM Share: ABB at 15%, Siemens and Tesla Among Major Players
ABB held a 15% share of the global DC fast charging solutions market, per International Energy Agency (IEA) data cited in the July 2026 Market Data Forecast EV Chargers report, making it the largest non-Tesla OEM by share in that dataset [S5]. Major players in the ultra-fast EV charging segment include ABB, Siemens, and Tesla, with Asia-Pacific commanding 72.28% of the 2025 ultra-fast charging systems market [S3].
Schneider Electric entered the DC fast segment in January 2025 with the Schneider Charge Pro for European commercial fleets and multifamily residences, targeting alignment with the EU Energy Performance of Buildings Directive (EPBD) charger-upgrade requirement [S4]. Asia-Pacific also led total EV charging infrastructure revenue with 53.41% share in 2025, against Europe as the fastest-growing region at a 40.50% CAGR through 2031 [S2][S4]. The CCS connector standard led with 35.95% (Mordor) to 40.72% (Precedence) of 2025 charging station revenue, depending on segmentation, with NACS now a parallel consideration in North America following Supercharger access opening.
Charger-Type Split: Fast vs Slow and Connector Standards
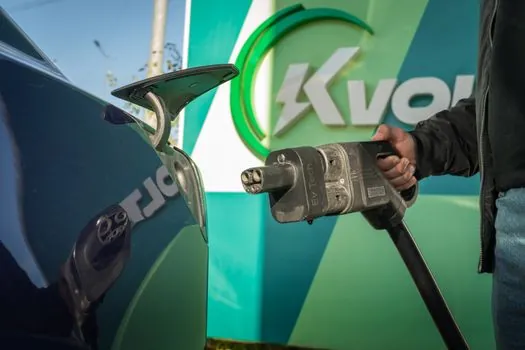
Fast chargers (DC) contributed 89.6% of the global EV charging infrastructure market share in 2025, while the slow-charger segment is forecast to grow at 26.1% CAGR through 2035, indicating that DC fast is both dominant and the faster-growing tier in absolute revenue [S4]. The commercial application segment generated 90.42% of 2025 charging-infrastructure revenue, confirming that fleet, retail, and corridor DC fast sites are the primary revenue base, not residential [S4].
Ultra-fast DC chargers, defined at 350 kW per NREL-cited data, can recharge vehicles in 10–15 minutes, up from the 50 kW systems prevalent in 2020, a power-density jump that reorders the OEM competitive set because legacy 50 kW cabinets cannot reach the new highway-corridor uptime targets [S5]. A comparison of the main DC fast options, by power class, typical site, and best-fit use:
50 kW DC fast (legacy): lowest $/kW, suited to destination/fleet depots, longer dwell times, declining share.
150–250 kW DC fast (mid): the workhorse class for retail corridor sites, balance of cost and charge time, common bid target for commercial RFPs.
350 kW ultra-fast (NREL-defined): 10–15 minute sessions, highway corridor and premium retail, requires grid upgrades and liquid-cooled cables, highest ASP and fastest revenue growth [S5].
The industrial DC power supply reference covers rectifier topologies, hold-up, and harmonic-mitigation design that directly inform the front-end of these three power classes. By ownership, public infrastructure accounted for 67.55% of 2025 charging station market size, expanding at 27.40% CAGR through 2031 [S2].
Regional Concentration: Asia-Pacific Dominates, Europe Fastest Growing
Asia-Pacific held 60.10% of the 2025 global EV charging station market by revenue (Mordor) and 53.41% by broader infrastructure revenue (Precedence), a 6–7 point spread that reflects how each house weights China OEM shipments versus installed-base depreciation [S2][S4]. China alone has integrated over 1.2 million charging stations via the State Grid Corporation, per Market Data Forecast's 2025 dataset, the largest single national deployment in the world [S5].
Europe is the fastest-growing region at 40.50% CAGR through 2031, driven by cross-border network alliances and the EU AFIR mandate for 1.3 million public chargers by 2030, while the US Bipartisan Infrastructure Law allocated $7.5 billion targeting 500,000 public chargers by 2030 [S2][S5]. The 2025 global EV charging station market was valued at USD 36.13 billion, projected to reach USD 112.55 billion by 2031 at 20.85% CAGR, with the broader infrastructure market sized at USD 47.61 billion in 2025 and forecast at USD 492.59 billion by 2035 [S2][S4].
Selection Criteria for Specifying a DC Fast Charger OEM
For a 2026 site build, four criteria separate the procurement shortlist: peak DC output (50 / 150–250 / 350 kW class), connector mix (CCS1, CCS2, NACS, CHAdeMO), network-software stack (OCPP 1.6/2.0.1, ISO 15118 Plug & Charge), and grid-side interoperability ( reactive power support, ISO 15118-20 bidirectional readiness) [S2][S4][S5]. ABB at 15% global DC fast share is the common default for European and utility-scale procurement where the IEA dataset recognises it as a global leader in high-power EV charging, while Tesla is the de facto North American reference for Supercharger-compatible NACS sites [S5].
Schneider Charge Pro targets the European EPBD-driven multifamily and commercial-fleet segment, not the highway-corridor ultra-fast class, and is best matched to 22–50 kW AC and 50–150 kW DC builds rather than 350 kW cabinets [S4]. For a true 350 kW highway bid, ABB, Siemens, and Tesla are the most consistently named majors; ChargePoint appears in network rankings but operates an asset-light model where most ports are third-party owned, a structural difference that affects uptime SLAs and total cost of ownership [S1][S3].
Limitations, Data Caveats, and Failure Modes
Three failure modes are visible in 2026 data: (1) port-count versus revenue divergence, where DC fast can show 77.95% of revenue but only about 42% of unit count, because high-power hardware carries a 5–10x price-per-port premium; (2) network-definition fluidity, where ChargePoint is listed as a top-4 US network while not owning most of its hardware, which inflates apparent share; and (3) NACS/CCS bifurcation, where connector share numbers from 2025 pre-date the broader NACS adoption wave and may shift 10+ points by 2027 [S1][S2][S4][S6].
Public DC fast charger utilization in urban hubs like California averages 15–20% per NREL 2023-cited data, a level that supports revenue per port but signals underused installed base during off-peak hours, and the data are now three years old relative to 2026 [S5]. A quote from the Mordor Intelligence report: "energy majors like Shell are closing petroleum stations and reallocating capital toward high-power chargers, signaling a strategic shift that intensifies competition," a fact that flags incumbents from petroleum retail entering the 350 kW bid set during 2026–2027 [S2].
Sourcing, Standards, and Trackable Signals
Standards governing DC fast charger deployment include ISO 15118 (Plug & Charge and bidirectional), OCPP 1.6/2.0.1 (network-protocol interoperability), IEC 61851-1 (conductive charging), and the EU AFIR (Alternative Fuels Infrastructure Regulation) mandate for 1.3 million public chargers by 2030 [S5]. For procurement engineers cross-checking power-conversion assumptions, the DC-DC converter selection topology map and the industrial DC power supply reference cover the rectifier-side design choices that sit behind every 50–350 kW cabinet.
Trackable signals to watch through Q4 2026: Tesla's US port share trajectory, which the AFDC predicted may fall below 50% in 2026 [S1]; the 2026 US public DC fast port total versus the 71,398 baseline on April 1, 2026, currently growing at over 1,000 stalls per month [S1]; and the next IEA Global EV Outlook update, which is the upstream source for the 15% ABB share figure cited in Market Data Forecast's July 2026 report [S5].
Spec-level background on the components involved: pressure transmitter.