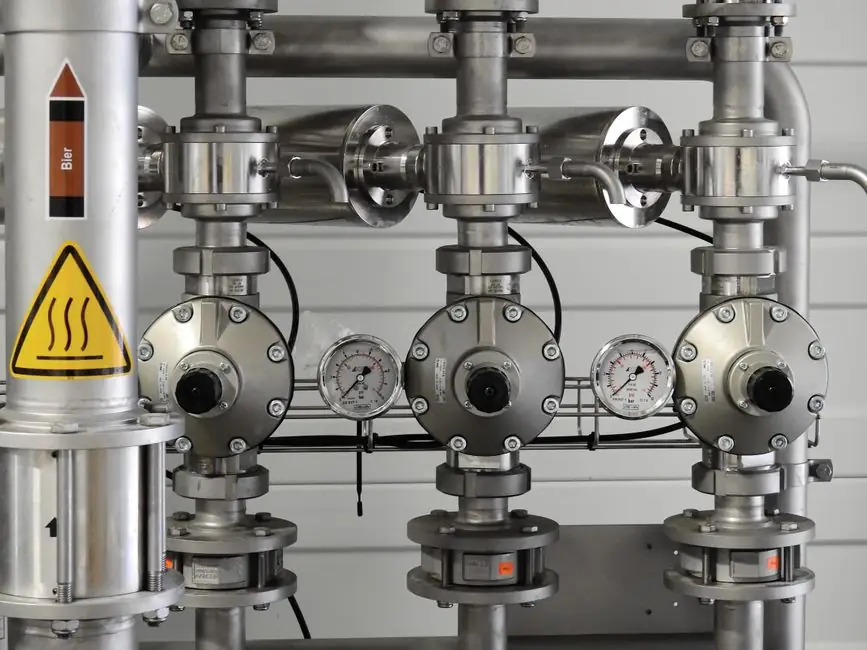
Seawater reverse osmosis (SWRO) train equipment cost segments into five dominant buckets, with the membrane array and high-pressure pumping section together typically absorbing 25-35% of the equipment-only capital figure on a mid-capacity plant [S2].
Major Cost Buckets and Typical Share Ranges
On a generic SWRO bill of materials, the five top-line buckets are intake and pretreatment, membrane modules plus pressure vessels, high-pressure pumps, energy recovery devices, and electrical/BOP. The brackish water reverse osmosis (BWRO) variant shifts the weighting toward membranes and well-field pumps, away from the energy recovery line item, because operating pressures drop from 55-80 bar (SWRO) to 10-30 bar (BWRO) [S2].
Material and Process Cost Drivers
Corrosion-resistant alloys such as super duplex (UNS S32750 / 1.4410) and high-grade stainless (316L) routinely appear on high-pressure pump casings, ERD rotors, and the RO train interstage piping, with super-duplex commanding a 2-4x material cost premium over standard 316L in fabricated skids [S2].
Thin-film composite polyamide membranes on a polysulfone support remain the industry default; consumption is sized around 0.4-0.6 m^2 of membrane area per m^3/day of permeate, with element price generally scaling with feed-water tolerance and boron rejection spec [S2]. For buyers evaluating pressure-vessel housings and instrumented skids, the pressure transmitter and flow meter lines frequently co-anchor a process train alongside the membrane vessels.
Selection Criteria: Where the Money Actually Goes
Three variables move the equipment number more than any others: feed salinity (TDS), which sets the osmotic pressure and therefore pump head; recovery rate, which is the fraction of feed converted to permeate; and energy recovery selection between isobaric (pressure exchanger) and centrifugal (turbocharger) devices, where isobaric units typically cut specific energy consumption to 2.5-3.5 kWh/m^3 versus 3.5-5.0 kWh/m^3 for pelton/energy-recovery turbocharger combinations at the same flux [S2]. For skids that need precise dosing on the cleaning-in-place side, buyers should anchor procurement specs around an industrial valve schedule that survives 6.9 bar CIP at 35 deg C without seat degradation.
Comparison of Cost Drivers by Desalination Technology
Three mainstream desalination paths show clearly different cost structures: SWRO is dominated by pumping and energy recovery, multi-stage flash (MSF) and multi-effect distillation (MED) are dominated by thermal energy input, and electrodialysis reversal (EDR) is dominated by electrode and membrane stack replacement. SWRO capital sits in the 900-2,500 USD/(m^3/day) band, MED typically 1,500-3,000 USD/(m^3/day), and MSF 2,000-4,000 USD/(m^3/day) at the unit capacity level [S2].
Buyers tracking this space alongside the spec-gate map of testing and inspection should pair this article with the broader quality standards guide, which lays out the documentation gate per bucket.
Volume Tier, Certification, and Lead Time: How They Move Price
Order quantity and module size matter. A 100,000 m^3/day single-train plant buys 6,000-9,000 8-inch RO elements (each rated 35-40 m^3/day at 99.75% nominal rejection), and the unit price on 8-inch elements commonly drops 15-25% when a single PO crosses the 5,000-element threshold, depending on the brand tier [S2].
Certification scope moves the pump and valve line items more than the membrane line items. For instrumentation in hazardous-area desalination halls, procurement notes that pair with the pressure sensor selection guide tend to surface when the certification driver is mentioned explicitly.
Total Cost of Ownership: Beyond the Sticker
Lifetime cost of ownership over a 25-year plant life is typically 2-3x the initial capex figure, with energy, membrane replacement, chemical cleaning, and scheduled pump/ERD overhaul being the four major OPEX contributors [S2].
The lowest specific energy consumption is not always the lowest LCOW (levelized cost of water): a higher-efficiency isobaric ERD adds 5-15% to the upfront cost of the rotating-equipment skid but pays back in 2-4 years on plants with annual energy cost above the local tariff threshold of roughly 0.08-0.10 USD/kWh, so ERD selection should be paired with the actual tariff input, not the OEM brochure [S2]. For buyers looking at material choices in adjacent capital goods, the broader nylon selection map covers PA6, PA66, PA11, and PA12, which show up on valve seats, filter housings, and brine pump impeller wear rings.
Signals to Track Over the Next Two Quarters
Watch three trackable signals: (1) membrane element list-price moves from the top three brand tiers, which usually lead the equipment-cost index by a quarter; (2) super-duplex alloy surcharges, which are published monthly and move the high-pressure piping line within weeks; (3) RO train commissioning throughput disclosures in EPC tender awards, which validate whether the 2.5-3.5 kWh/m^3 SEC claim is being met on operating plants [S2].
Each signal is verifiable through OEM press, alloy-surcharge indices, and the IDA Desalination Yearbook, which publishes annual performance statistics; the next edition typically lands in Q4 of the calendar year [S2].