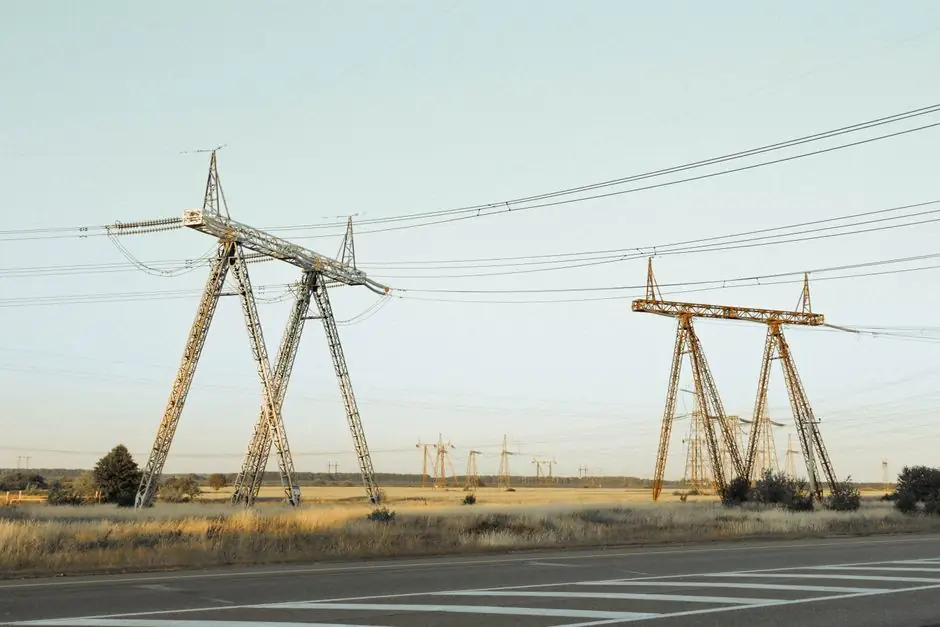
U.S. grid investment over the next ten years is split 37% transmission and 63% distribution on a base of roughly $1 trillion, with distribution carrying the larger share but transmission growing faster globally [S2].
Globally, transmission capex is projected to expand at almost twice the rate of distribution through 2030, while cumulative grid spend is forecast at $5.8 trillion between 2026 and 2035, of which about $700 billion (12%) is earmarked for digital grid technology [S2][S7].
How the 2026 dollar split actually looks
Distribution takes the larger share in the U.S. at 63% of the ~$1 trillion decade total, leaving transmission at 37%, a ratio that has been widening as data center load and electrification push the lower-voltage network [S2]. In Europe, the European Grids Package published in December 2025 sets a €1.2 trillion requirement through 2040, with €477 billion allocated to distribution and the balance covering transmission and supporting infrastructure [S9]. The Electricity 2026 analysis calls for annual grid investment to increase by approximately 50% by 2030 from a USD 400 billion baseline to meet electricity demand [S5]. BloombergNEF's December 2025 outlook puts the 2025 global grid total above $470 billion for the first time, with transmission compounding at roughly 16% annually versus a slower distribution line [S7].
Transmission growth rate versus distribution growth rate
Transmission is the higher-CAGR line in nearly every dataset for 2026-2030. BNEF's 16% transmission CAGR through 2030 sits against a distribution CAGR closer to half that pace, a gap driven by long-haul line builds and HVDC interconnectors [S7]. DOE's current program targets a 16% expansion of long-distance transmission line capacity by 2030, including 7,500 miles of new line, which sets the U.S. federal baseline behind that growth [S1]. Power demand itself is the upstream driver: 2026-2030 global demand is projected to grow at 3.6% CAGR, roughly 50% higher than the prior decade, with data centers alone contributing 465 TWh of incremental demand over five years and electrification (EVs, heat pumps) adding another 25% slice [S2]. Distribution grows in absolute dollars but at a slower percentage pace because most of the marginal MWs have to be moved across regions first, not just stepped down locally.
What gets bought at each voltage level
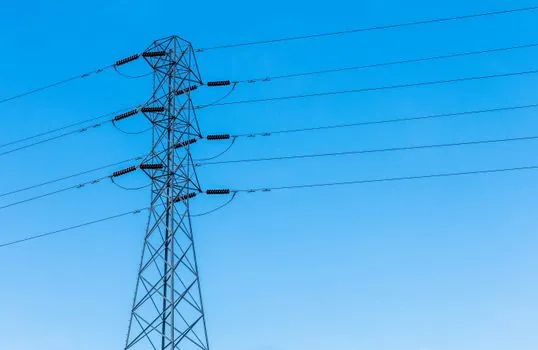
Distribution spend concentrates on the assets that connect the load: pad-mount and substation transformers, MV/LV switchgear, distribution cabinets, cable distribution cabinets, power distribution boxes, reclosers, and the secondary network that ties rooftop solar, EV chargers, and heat pumps to the feeder. Transmission spend concentrates on the bulk system: 230 kV to 765 kV overhead line, HVDC converter stations, large power transformers, series compensation, and the substation buswork that aggregates generation. The asset categories only overlap in the substation transformer and protection relay layer, which is why utilities and EPCs running mixed portfolios (see typical MCC and one-line practice in MCC elevation vs one-line vs unit wiring diagrams) tend to size capex programs separately for each domain. [S2]
Digital investment: the variable that flips the cost-benefit ratio
A 2025 system-dynamics study of the Portuguese DSO quantifies the trade-off that is now driving distribution capex reallocation: physical grid reinforcement yields about 0.18% reliability improvement, while digitalization (sensors, ADMS, DERMS, communications) delivers about 1.7%, a roughly 9x ratio on the same spend envelope [S4]. The same study finds that grid investment pushes end-user tariffs up by about 0.24%, while digitalization moves tariffs by only 0.07%, a 3x difference in rate impact [S4]. Practically, that means a distribution utility maximizing SAIDI/SAIFI on a constrained budget can buy more reliability per dollar by stacking digitalization on top of existing power distribution assets, rather than by trenching new cable. The reliability-vs-tariff ratio is the strongest published argument for digital-first distribution capex in 2026.
Hardware comparison: distribution components vs transmission components
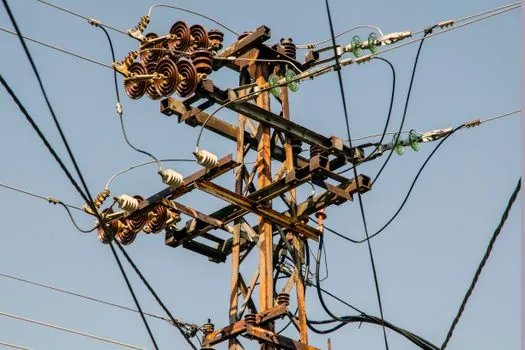
For a utility or industrial specifier choosing where to deploy capital, the practical comparison is short. (a) Unit cost: distribution-class switchgear and power distribution boxes are 10x to 100x cheaper per unit than a 345 kV+ breaker, but thousands more units are needed per project. (b) Lead time: distribution transformers and pad-mount gear are commonly 26-52 weeks in 2026, while large power transformers at 230 kV and above are running 100-150 weeks depending on manufacturer, which is itself a transmission-growth bottleneck. (c) Lifetime: 30-40 years for distribution transformers versus 40-60 years for transmission-class power transformers, with both classes subject to NEMA/IEEE loading guides. (d) Integration effort: distribution assets typically drop into a feeder-management scheme with minor SCADA point additions, while transmission assets require system-impact studies, NERC facility-rating updates, and protection coordination across multiple zones. For a capital allocator, the rule of thumb in 2026 is: put digitalization on the distribution side for fast reliability wins, and put hard assets on the transmission side to unlock the next GW of transfer capacity. [S2]
Who this split is for, and who it is not for
The 37/63 U.S. split and the 16% global transmission CAGR are useful framing for utility capex planners, IPP developers siting wind and solar interconnection, industrial customers evaluating behind-the-meter options, and policy teams sizing grid-modernization incentives. They are not useful for short-cycle residential solar or storage ROI modeling, where distribution-level tariff design and interconnection-queue depth matter more than the headline spend ratio. The investment tilt also does not apply symmetrically: in Asia Pacific, cumulative 2026-2035 grid investment is projected near $2.6 trillion with China representing more than two-thirds of the regional total, a concentration that pulls the global weighted distribution share higher than the U.S. or European figures would suggest [S2].
Failure modes and constraints engineers should track
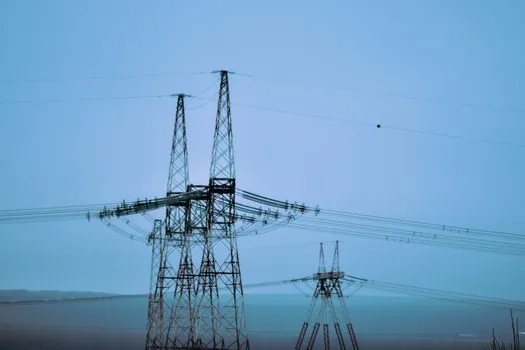
Three constraints cap how fast either line can grow in 2026. First, siting and permitting: long approval timelines for transmission line right-of-way remain the single biggest schedule risk, and they are explicitly called out as the rate-limiting step in the U.S. outlook [S2]. Second, equipment supply: large power transformer and HV breaker capacity is tight globally, which means a 16% transmission CAGR is an aspiration, not a delivered number, until more factory capacity comes online. Third, explosion-proof distribution and hazardous-area requirements at refinery and LNG-adjacent substations add a separate compliance layer (IEC 60079-series, ATEX 2014/34/EU, NEC Class I Division 1/2) that does not appear in macro-level capex tables but shows up in the unit-cost line. The takeaway: distribution dollars are politically easier to approve and faster to deploy; transmission dollars buy bigger system value but spend 5-10 years in development before they energize.
Trackable signals through 2026-2027: the FERC transmission planning rulemakings and any subsequent ISO/RTO cost-allocation decisions, the next IEA Electricity mid-year update for revised 2030 grid investment totals, and DOE Loan Programs Office disbursements against the 7,500-mile transmission target [S1][S5]. For distribution, watch the 2026 state regulatory rate cases where digitalization capex is being explicitly carved out from physical reinforcement spend, the mechanism the Portuguese study says delivers the best reliability-per-dollar ratio [S4].