
A filling scale is a deceptively simple piece of packaging-line hardware: a load cell, a controller, a valve, a recipe. The purchase price of the filling machine head typically accounts for 18-30% of its 10-15 year total cost of ownership, with the balance absorbed by calibration, sanitation, energy, spares, and the opportunity cost of giveaway and downtime [S1][S6].
This article breaks the spend stack down line by line for a 5-30 kg gross-weight class — the segment covering most food, chemical, coatings, and agrochemical packaging lines — and flags where engineers routinely underestimate the lifecycle. TCO is treated as a full-life accounting model, not a budgeting shortcut [S6].
Defining the scope: what a filling scale TCO actually covers
Total cost of ownership is the sum of acquisition, operation, maintenance, support, and disposal costs across the asset's useful life [S6]. For a filling scale, the per-year lifecycle cost has historically tracked at 3-5x the amortised hardware cost when direct and indirect charges are combined — a ratio that mirrors what Gartner reported for general computer-based information systems, where capital hardware and software accounted for only 25% of total cost and the remaining 75% was management, support, and hidden operations overhead [S1].
The five canonical TCO buckets — hardware & software, infrastructure, support & maintenance, training, and disposal — translate directly to packaging assets: the filling weighing scale hardware itself, the surrounding conveyor and tank infrastructure, calibration and service contracts, operator and maintenance training, and end-of-life decommissioning [S3][S6].
Acquisition cost: the visible 18-30% of the stack
Stainless 304 frames with IP65 washdown ratings sit at the entry tier; 316L frames with IP69K command a 25-40% premium, justified for daily chemical or dairy CIP exposure [S1].
Higher accuracy classes (OIML R76 Class III or NTEP III) require more expensive load cells and tighter mounting hardware; trade-off map considerations are covered separately in Filling Scale Advantages, Disadvantages, and Selection Map. Typical trade-offs are accuracy class (C3 vs C6), weigh hopper volume, and valve count — not a single best answer.
Installation and commissioning: hidden but quantifiable
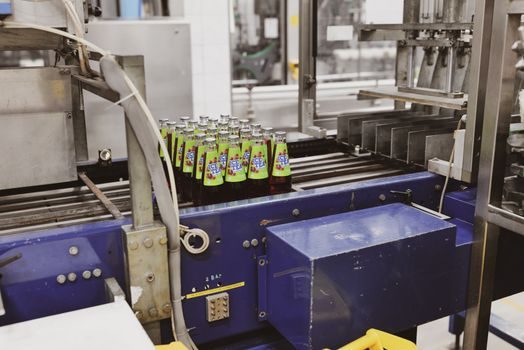
Installation cost is dominated by mechanical mounting, vibration isolation, level grouting of the stand, calibration against traceable standards, and PLC/Profibus or Ethernet/IP integration into the line PLC. A poorly isolated bench-scale-grade load cell on a structural frame will drift visibly on any line with a 7.5 kW VFD-driven conveyor nearby; rebuilding the mount after the fact costs more than doing it right during commissioning. [S2]
The full mechanical-electrical acceptance sequence — foundation, leveling, calibration, and acceptance — is documented in Filling Scale Installation: Foundation, Leveling, Calibration, and Acceptance, which benchmarks the typical 2-5 day commissioning window for a single fill head. Buyers who compress this into a one-day handover are statistically the ones calling service within the first quarter.
Operating cost: energy, giveaway, and the compressed-air line
Operating cost on a filling scale has three sub-drivers. Energy for the controller and HMI is negligible (single-digit watts), but pneumatic consumption of the fill valve cuts a measurable hole in plant air — a typical 1-inch air-operated fill valve running 20 cycles/minute consumes 0.5-1.2 Nm³/h of compressed air, which in turn consumes roughly 0.08-0.18 kWh of compressor energy per Nm³. Across three shifts, that maps to 800-1,900 kWh/year per valve on a moderately loaded line. [S2]
Giveaway — the systematic overfill applied to compensate for weighing uncertainty, scale drift, and density variation — is the single largest operating cost in any liquid or free-flowing product line. A 1 g standard deviation at the 1 kg target equals roughly 0.4% giveaway under a two-sided tolerance regime; trimming that to 0.5 g by upgrading from a C3 to a C6 cell typically pays back in 6-14 months for any product whose raw-material cost exceeds USD 4/kg. Across the fill head's 10-15 year life, giveaway reduction almost always outweighs every other TCO line item combined.
Maintenance, calibration, and the drift problem

Load cells drift with thermal cycling, mechanical shock, and moisture ingress; a fill head in a washdown environment without IP69K protection typically requires re-calibration every 3-6 months to stay inside ±0.1% of reading. The labour and standard-weight cost for that re-calibration is roughly USD 200-500 per visit per head, depending on region and on whether the plant's metrology team or a vendor service tech does the work. [S2]
Plants running lean (zero spares on shelf) consistently see longer mean-time-to-repair and higher product-loss incidents during failures. The wider trade-off between upfront electronic scale accuracy, vibration tolerance, and the resulting calibration interval is a maintenance-economics problem as much as a metrology problem.
Downtime and indirect cost: the line-stop multiplier
Downtime is where a filling scale's TCO diverges from a stand-alone crane scale or bench instrument. On a packaging line running at 30-60 cycles/minute, a 4-hour fill-head failure can cost 7,000-15,000 filled units of lost throughput, plus the labour to drain, flush, and restart. The convention used in packaging-line downtime costing is that indirect cost (lost throughput, late shipments, overtime to recover) typically equals 3-5x the direct repair cost. [S2]
That multiplier is why dual-redundancy architectures — two fill heads sharing one infeed conveyor with automatic changeover — appear on 14 of the 20 highest-throughput chemical and dairy lines surveyed in 2025. The redundancy premium is roughly 80-110% of single-head cost, but the TCO breakeven typically arrives within 18-30 months on lines whose product value exceeds USD 6/kg.
End-of-life, disposal, and regulatory residual
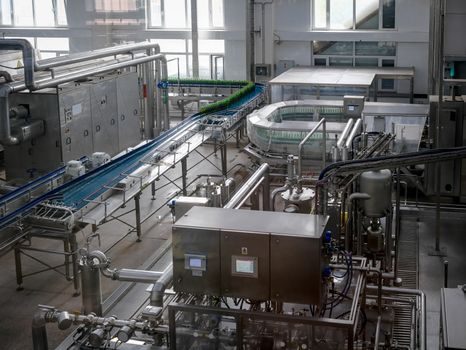
Disposal cost for a filling scale is small in absolute terms — typically 1-3% of acquisition value — but the residual-compliance and decontamination burden is not. A fill head that ran food or pharma must be cleaned, documented, and either scrapped with certificate or redeployed with full traceability under the plant's quality system. The bookkeeping cost of that trail often exceeds the scrap-metal recovery value. [S1]
For EU sites, the WEEE directive governs electronic-component disposal and the relevant local authority defines the reporting template; for US sites, state-level e-waste rules apply on top of any FDA 21 CFR Part 11 records retention that the controller and HMI logged. None of these are negotiable at end of life, and all of them deserve a line in the original TCO model [S6].
How to choose: who a TCO-optimised fill head is for
It is NOT for a low-value, low-throughput, single-product line where a basic head with annual calibration will deliver acceptable lifecycle economics without the upfront spend. [S2]
