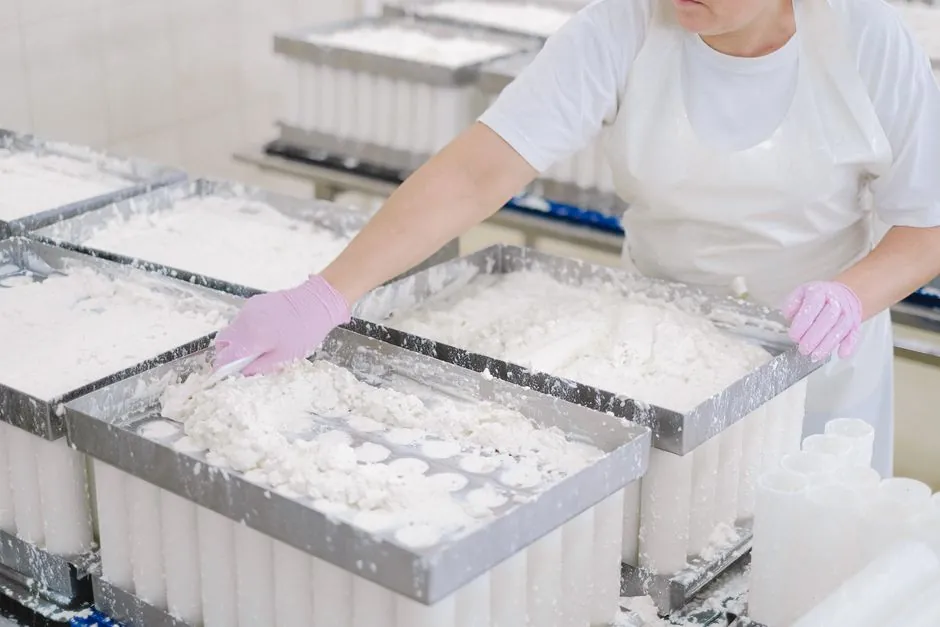
Four independently sized 2026 market reads put the food processing equipment market between USD 59.0B (Grand View Research, 2026 base) and USD 68.27B (Research and Markets), with CAGR bands of 4.2%, 5.30%, and 6.3% across 2026 to 2033/2034 [S1][S2][S7]. The widest-bucket number, which folds in handling, packaging, and service equipment, is USD 132.7B in 2026, projected to USD 200.9B by 2033 at 6.1% CAGR [S5].
Food processing equipment alone holds 52.8% of that combined product-type revenue, automatic lines take 54.8% of automation share, beverages lead applications at 19.3%, and Asia Pacific is the fastest-growing region at a projected 7.4% CAGR against North America's 5.4% [S5]. Spend logic for 2026 is being driven less by new product categories and more by three forces: labour-replacing automation, regulator-driven traceability retrofits, and capacity additions in China, India, and Southeast Asia [S3][S4][S5].
Market sizing: where the four 2026 estimates diverge
Grand View Research sizes the equipment market at USD 59.0B in 2026, scaling to USD 78.7B by 2033 at 4.2% CAGR, with a 2025 base of USD 56.8B [S1]. Fortune Business Insights lands higher, at USD 62.97B in 2026, growing to USD 95.18B by 2034 at 5.30% CAGR [S2]. Research and Markets posts the highest equipment-only 2026 figure, USD 68.27B, with a USD 87.14B 2030 endpoint at 6.3% CAGR [S7]. Precedence Research sits in the middle on a 2025 base of USD 57.80B scaling to USD 87.82B by 2035 [S8].
The gap is not contradiction but scope: persistence market research (PMR) folds in food processing, food packaging, and food service and handling equipment, which is why its 2026 value is USD 132.7B and 2033 value is USD 200.9B at 6.1% CAGR [S5]. For a buyer benchmarking line-item spend, the USD 59.0B to USD 68.27B band is the apples-to-apples read; the USD 132.7B figure is the right reference for total plant-level capex including packaging and handling skids [S1][S2][S5][S7].
What's actually driving 2026 orders: automation, compliance, capacity
Three forces, not ten, are doing the lifting in 2026 spec sheets. First, robotics and intelligent processing lines: modern cells integrate machine vision and real-time data to handle delicate baked goods through to heavy palletizing, with end-to-end automated workflows connecting mixing, forming, packaging, and palletizing into a single controlled line [S3]. Second, traceability and "radical transparency": AI is being deployed as a plant-wide control layer, but under tighter validation rules, with traceability moving from nice-to-have to non-negotiable across major processors [S6]. Third, supplier consolidation: one-stop vendors offering a full range of slicers, depositors, conveyors, and robotics under a single support contract are gaining preference over fragmented supply [S4].
Capacity is the volume engine. PMR's regional split puts Asia Pacific at 7.4% CAGR versus North America at 5.4%, with China, India, and Southeast Asia leading plant additions [S5]. The SCADA demand 2026-2030 outlook tracks the same pattern in adjacent industrial automation, where Asia is the single largest regional spend driver across food, pharma, and power; food processors pulling new lines are pulling new SCADA along with them, which is why both markets are growing above global industrial automation averages.
Product-type and application split: where the dollars sit
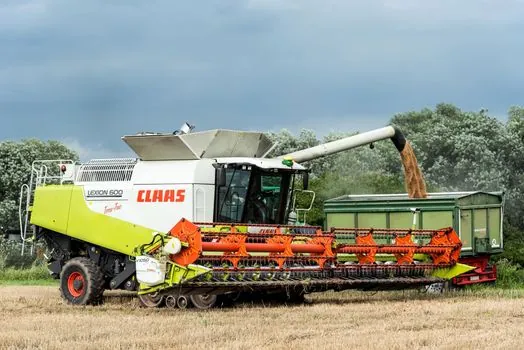
Food processing equipment accounts for 52.8% of the combined PMR segment, while food packaging equipment is the fastest-growing sub-segment at 6.7% CAGR through 2033 on the back of sustainable packaging formats, automation, and shelf-life extension [S5]. On the automation axis, automatic equipment holds 54.8% share with semi-automatic expanding at 5.2% CAGR, a split that maps directly to processor size: large plants are buying full automatic skids, while small and mid-sized operators are still stepping up from manual cells [S5].
On applications, beverages lead at 19.3% share, with fruits and vegetables the fastest-growing application at 7.1% CAGR through 2033 [S5]. The 7.1% fruit-and-vegetable growth tracks the same plant-floor reality seen in polypropylene resin Industry 4.0 adoption: packaging format changes (mono-material PP, recyclable pouches) are pulling new processing and packaging skids as a pair, not as separate upgrades. Bakery and confectionery, meat and poultry, dairy, seafood, and grain and cereals round out the standard application split tracked by PMR's segmentation [S5].
Spec criteria: matching equipment class to plant profile
For a greenfield beverage or dairy plant in Asia Pacific, the spec gravitates to fully automatic processing and packaging skids, often with vendor-furnished line integration, because throughput-per-labour-hour and FSMA-equivalent traceability are non-negotiable, and supplier one-stop support is preferred to fragmented multi-vendor hand-offs [S4][S5]. For a small or mid-sized processor in North America, semi-automatic at 5.2% CAGR is the practical path: lower capex, faster ROI, and easier validation cycles under existing FDA/FSMA controls [S5].
For frozen, bakery, or prepared-foods lines where product handling is delicate, the spec driver is robotics integration at the slice-and-apply and depositor stages, paired with vision-guided QC, rather than raw throughput [S3]. For fruit and vegetable processors, the binding constraints are wash-water recirculation, sanitary conveyor design, and pack format flexibility, with the 7.1% application CAGR driven by shelf-life and clean-label demand rather than throughput alone [S5]. Across all of these, suppliers with parts, service, and retrofit capability under one roof are the ones being written into 2026 RFQs [S4].
Adjacent spend signals worth tracking in 2026
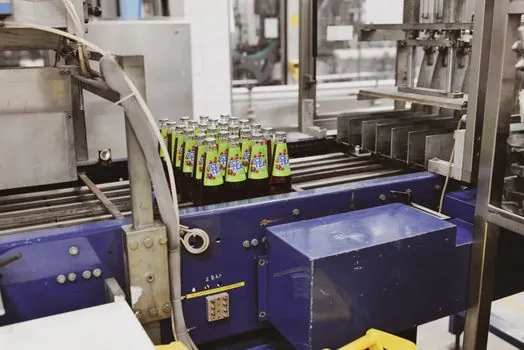
Two cross-industry reads are useful leading indicators for food capex. First, the data center cooling 2026 sizing and liquid cooling surge shows industrial cooling demand is shifting toward higher-density liquid loops; food processors running large refrigeration and chiller loads should expect parallel efficiency pressure on cold-side equipment, even though food specs are not the article's primary scope. Second, the additive manufacturing material suppliers 2026 map signals where food-grade 316L and sanitary-grade spares are starting to be printed on demand, an emerging pattern for low-volume, high-mix sanitary fittings rather than mainline processing skids. [S3]
Trackable 2026 indicators: (1) Asia Pacific's 7.4% CAGR realisation in published Q3/Q4 OEM order books, which will confirm or refute the regional lead; (2) food packaging equipment's 6.7% CAGR trajectory, since it is the fastest sub-segment and a clean proxy for sustainable-packaging retrofit cycles [S5].
Component reference pages worth checking: ndt equipment, anti static equipment, and construction machinery and equipment.