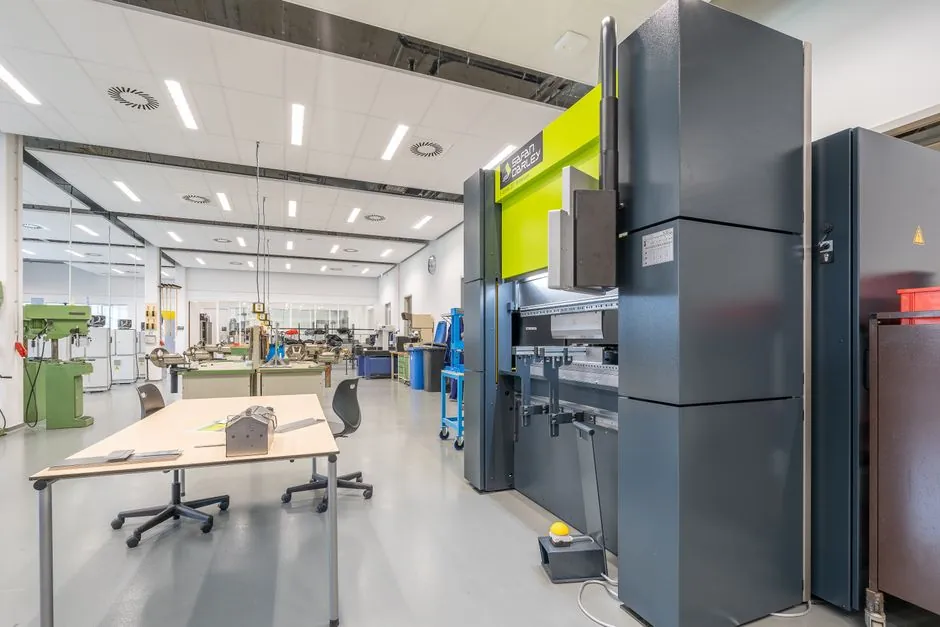
Industrial pump production lines in 2026 sit at the intersection of a USD 50.46 billion global market, a 61.85% centrifugal-pump revenue share, and a factory floor that cannot tolerate the USD 8,000 to USD 24,000 per hour downtime bill a single failed pump inflicts on the plant it feeds [S3][S1].
The line-design problem is not which impeller to machine first; it is the layout of stator winding, impeller balancing, mechanical-seal fitting, hydrostatic test bays, and an instrumented final-test cell that feeds a MES, with throughput math driven by finite-hour bottleneck analysis rather than nameplate cycle times, as detailed in this pump factory capacity planning guide.
Mix and Cell Architecture Match Pump-Type Distribution
Centrifugal pumps commanded 61.85% of 2025 industrial pump revenue, submersible units 30.75%, and positive-displacement designs the residual share, with progressing-cavity pumps forecast to grow at 7.45% CAGR through 2031 [S3]. A production line that mirrors that 60/30/10 split will carry three physically distinct cells: a horizontal split-case centrifugal cell with impeller balancing and laser alignment, a canned-motor submersible cell with stator potting and Megohm winding test, and a positive-displacement cell with gear-hobbing, screw profiling, and pressure-relief valve setting.
Each cell carries its own dominant failure signature that the line must be built to test against: bearing wear develops over 14 to 21 days before seizure on centrifugal units, motor-winding insulation fails prematurely when coolant contamination is present on submersibles, and internal leakage in PD units shows up as a power-consumption rise that must be trended on the test stand [S1]. Designing the test bay to capture vibration, motor current, and flow-versus-head curves per unit, not per batch, is what separates a 2026 line from a 2016 one.
Bottleneck Discipline Beats Nameplate Takt
The economic gravity of pump lines is well documented: unplanned pump failure on a customer plant costs USD 8,000 to USD 24,000 per hour in lost production, plus emergency contractor fees after hours, which is the same number that defines how much capital a pump factory can spend on a single test cell [S1]. Nameplate cycle times from a CNC catalog are fiction in a pump plant; the real takt is set by the slowest of impeller machining, stator winding, mechanical-seal press fit, and the hydrostatic test bay, where a 30 minute hold at 1.5 times rated pressure is common for ANSI B73.1-style units.
A 2026 pump line should be modelled with finite-hour bottleneck math, not theoretical OEE, because predictive-maintenance IoT on the line itself can cut downtime roughly 30% and maintenance cost roughly 45% per published iFactory-platform figures [S1]. For pump plants that have already instrumented their customer base with similar sensors, building the same stack into the production line is a near-zero extension; the factory simply becomes the first site to consume its own telemetry.
Material, Seal, and Hydrotest Selection Criteria
Three spec decisions govern pump-line cell selection more than any other: impeller material (cast iron, ductile iron, CD4MCu duplex, 316L stainless, hard-metal alloys for dewatering service), mechanical seal type (single cartridge, dual pressurized, gas-lubricated for hot oil), and test medium (water for general service, kerosene or light oil for food and hygienic duty, inhibitor-treated water for cast-iron units to prevent rust during the 30 minute hydrostatic hold) [S2][S1]. Cornell's eight-decade trajectory from a 1946 service shop to a global centrifugal-pump supplier shows how material range and seal technology compound: the company entered food handling in 1964 with a single-port impeller and offset volute to limit damage to delicate media, then moved into hot-oil fryer service in the 1980s with seal packages rated for continuous elevated-temperature immersion [S2].
Instrumentation, Predictive Maintenance, and the Smart-Pump Feedback Loop
Smart-pump features such as real-time health monitoring, location telemetry, and remote performance dashboards are now table stakes in OEM offerings, with predictive-maintenance IoT service models adding an estimated +0.9% impact to the market CAGR on a short 2-year horizon, led by developed markets [S3][S2]. A 2026 production line should not just assemble smart pumps; it should test the IoT stack on the final bench, with a cellular or Ethernet gateway that pings a cloud endpoint as part of the end-of-line checklist, so a failed sensor module is caught before ship-out rather than at customer commissioning.
The smartest pump factories are the ones that consume their own telemetry. Vibration baselines collected at the impeller-balancing station, acoustic fingerprints from the gear-hobbing cell, and motor-current signatures from the stator winding cell all feed the same anomaly-detection stack the customer receives, which shortens failure-prediction lead times and grounds the 7 to 14 day prediction window in production-floor data rather than laboratory curves [S1]. The wider Industry 4.0 adoption picture for smart pumps, including where the 2026 reality still lags the marketing, is mapped in this smart-pump spec reference.
Power Source, Orientation, and Geographic Capacity Signals
Electric-driven systems held 77.95% of 2025 industrial pump revenue, with solar-powered units growing fastest at 11.1% CAGR to 2031; submersible pumps accounted for 30.75% of 2025 revenue while surface pumps grow fastest at 9.85% CAGR [S3]. A pump factory building new capacity in 2026 should weight its cell mix toward the surface, electric-driven centrifugal design that dominates volume, but reserve a flexible submersible sub-line (stator potting, Megohm winding test, canned-motor assembly) because the MEA petrochemical diversification wave and Asia-Pacific infrastructure build-out pull submersible mix up in any export-oriented order book [S3].
Two verifiable signals worth tracking through the next planning cycle: the United States has earmarked more than USD 50 billion for water-infrastructure upgrades between 2022 and 2026, and the US EPA's long-term wastewater-rehabilitation need is estimated above USD 744 billion, both of which are public figures that translate directly into centrifugal and submersible sewage-pump tender volume [S3]. Capacity decisions taken on those two numbers alone will out-perform decisions taken on regional GDP growth assumptions, which is the only honest way to size a greenfield pump line in 2026.
For component-level specifications, see molding line, automatic molding line, and conveyor sorting line.