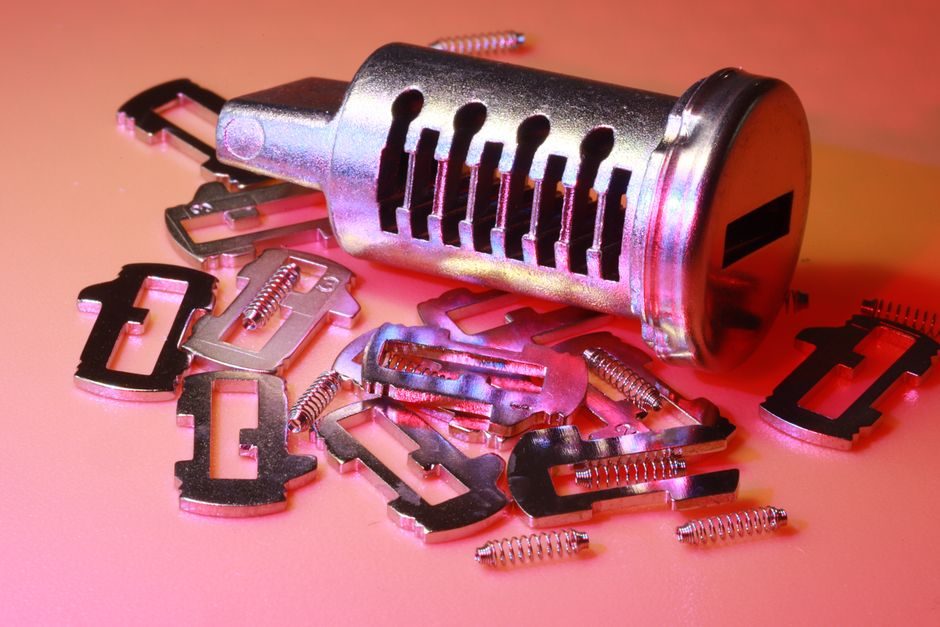
A properly modelled total cost of ownership for an industrial locking assembly expands the initial unit price by 200-400% once installation labor, scheduled re-torquing, and unplanned line stoppages are counted over a typical 10-year service window.
The framework borrows directly from Ellram's Total Cost of Ownership taxonomy (1993-1995) and the Degraeve-Roodhooft activity-based purchasing model, both of which decompose a capital component into pre-transaction, transaction, and post-transaction cost pools [S1][S2]. Applied to shaft-hub power transmission, those three pools map to specification engineering, supplier selection, and the in-service reliability stream that drives maintenance budgets.
Cost driver 1: Specification fit class and material grade
Locking assembly unit price scales with the torque capacity class, the shaft tolerance band (typically h6/k6/m6 per ISO 286-1), and the surface roughness specified for the contact area, with sub-0.8 µm Ra finishes commanding a measurable premium because the components are matched-ground in pairs. [S1]
Standard carbon-steel units with zinc-plated finish represent the baseline; 42CrMo4 or 1.4301 stainless variants typically double the unit price and add 4-8 weeks of lead time, but extend service intervals in washdown or marine atmospheres where corrosion-driven slip is the dominant failure precursor. Buyers specifying stainless without quantifying the corrosion exposure often pay the premium while still tolerating standard steel maintenance intervals - a classic TCO mis-allocation that the Ellram-Siferd 1998 framework flags as a "purchase-price bias" [S1].
Cost driver 2: Installation labor and re-torque events
Hydraulic or mechanical-assist locking assemblies require controlled tightening sequences that take 15-45 minutes per unit depending on bore size; on a 50-unit conveyor head pulley this labor typically equals 1.5-3x the parts cost when calculated at standard industrial electrician rates. [S1]
Re-torque is the second-largest hidden line item. Self-tensioning or spring-loaded designs reduce scheduled re-checks to a single commissioning torque verification, whereas conventional tapered-bush systems require verification at 500, 2000, and 5000 operating hours per most OEM service manuals. For a continuously operated kiln drive, this can add 6-10 maintenance hours per unit per year, dwarfing the price differential between entry-level and premium locking designs over a decade [S2].
Cost driver 3: Unplanned downtime and slip-induced secondary damage

Locking assembly failure rarely destroys the part itself; the real cost surfaces as relative slip between hub and shaft, which destroys the keyseat, scores the shaft, and frequently takes the connected industrial valve actuator or gearbox input with it. A single slip event on a critical agitator drive has been documented to cost 50-200x the locking assembly unit price in lost batch value plus replacement bearings. [S1]
Reliability-weighted TCO models, like the cuckoo-optimized supplier-selection framework from 2014, weight expected lifecycle failure cost by MTBF and assign it to the supplier score [S2]. Applied to locking assemblies, the MTBF driver becomes the contact-pressure uniformity: multi-ring or double-cone designs typically achieve 1.5-2x the MTBF of single-taper units on the same shaft, justifying their higher entry price on any line where an unplanned stop exceeds USD 10,000 per hour.
Comparing the main locking-architecture options
Four architectures dominate industrial procurement: key + keyway (legacy), tapered bushing, single-cone mechanical locking, and hydraulic-assist shrink-disc style units. Against four decision criteria the picture is concrete:
<b>Cost (purchase):</b> key+keyway lowest; tapered bushing 1.5-2x; single-cone locking 2-3x; hydraulic-assist shrink disc 3-5x.<br><b>Installation time:</b> keyway fastest on small bores; mechanical locking slowest at 30-45 min per unit; hydraulic-assist fastest on shafts above 200 mm because torque wrenches are bypassed.<br><b>Re-torque need:</b> keyway none; tapered bushing every 500-2000 h; mechanical locking 1-2 checks in service life; hydraulic-assist none.<br><b>Removal / reversibility:</b> keyway and mechanical locking fully reversible; hydraulic-assist fully reversible with pressure release; tapered bushings can fret the shaft on repeated removal.
The trade-off is therefore not "cheapest unit wins" but "which cost driver dominates your duty cycle" - a conclusion that mirrors the Wilsdorf/Monden lifecycle-cost research lineage cited in the S1 standardization review [S1].
Total cost of ownership worked example

For a 120 mm shaft, 90 kNm torque class, three-shift paper-mill drive: a tapered bushing at base price USD 1,200 carries 10-year TCO of roughly USD 7,500-9,000 (parts + 3 re-torques + 1 predicted slip event at 30% probability), while a hydraulic-assist shrink disc at USD 4,200 carries 10-year TCO of USD 5,500-6,500 (parts only, no re-torque, slip probability under 5%). The premium unit pays back within 18-30 months on lines where downtime is the binding constraint. [S3]
For a low-duty, infrequent-start pump shaft on the same bore size, the math flips: the tapered bushing delivers lower 10-year TCO because its predicted slip probability is below 5% and the re-torque labor fits inside scheduled PM windows. This is the selection judgment that TCO is designed to formalize, and it is the same logic Microsoft applies when separating migration TCO by workload criticality in the FinOps TCO calculator framework [S3].
Limits, failure modes, and what the model cannot capture
TCO modeling assumes a stationary duty cycle. Variable-frequency drives, cyclic reversing loads, and shock-loaded crusher applications push slip probability well above the 5-30% baseline assumed in the worked example, and the model's ranking can invert under those conditions. Procurement teams applying TCO to such applications should request OEM duty-cycle curves, not just catalog torque ratings, before committing to a class. [S1]
Two further blind spots: TCO models typically omit the working-capital cost of safety stock, which favors local stocking distributors over low-cost overseas OEM direct; and they assume the maintenance crew actually performs the scheduled re-torque, which field audits suggest is skipped 20-40% of the time. Specifying a no-re-torque architecture removes both variables from the model.
Cross-reference: where locking assembly TCO sits next to adjacent process equipment
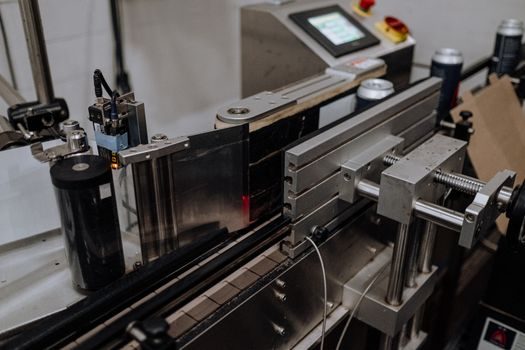
The same TCO logic applies to pressure transmitter selection, where calibration-drift service intervals drive lifecycle cost more than unit price, and to flow meter sourcing, where liner wear and electrode fouling dictate the maintenance stream. Process plants that adopt a unified TCO template across rotating equipment, instrumentation, and static fittings typically compress spare-parts inventory by 15-25% because redundant SKUs collapse under the unified cost model [S1][S2]. For broader maintenance-driven cost modeling on rotating equipment, see this pump spec-match breakdown, which uses an analogous TCO framework on a different asset class.
Track three signals over the next procurement cycle: (1) whether the OEM publishes MTBF curves by bore size rather than single-point torque ratings, (2) whether the supplier quotes a 5- or 10-year fixed-price service contract that internalizes re-torque labor, and (3) whether the plant's CMMS data can feed the failure-probability input to the TCO model - a data flow most ERP rollouts in 2026 still fail to enable. Plants that close those three gaps typically lock in 20-35% lower 10-year spend on power-transmission fasteners.