Lost Foam Casting (LFC) — also called Evaporative Pattern Casting — uses an expanded polystyrene (EPS) foam pattern vaporized by molten metal inside an unbonded sand flask, eliminating the need for draft, cores, or parting lines in most designs [S5]. For a 1,500-3,000 t/yr aluminum LFC cell, total 10-year cost of ownership commonly lands between $2M and $15M+, with the spread driven by pattern density, sand-system capacity, and reclamation choice rather than the casting machine itself [S1][S2][S3].
This TCO analysis breaks down capital, tooling, energy, labor, consumables, and end-of-life costs for a greenfield lost foam casting line, and benchmarks it against the more familiar molding line routes so a process engineer can defend the line item to procurement.
Capital Cost Stack: What a 2026 LFC Cell Actually Costs
A complete lost foam cell in 2026 has six equipment blocks: (1) EPS pre-expander and pattern molding station, (2) pattern assembly and glue line, (3) sand filling/vibration table and flask, (4) pouring furnace (often a line-frequency furnace holding 1-3 t), (5) shake-out and sand cooling/reclamation, (6) finishing and inspection. The dominant capex line items are the furnace, the sand system, and the pattern shop [S1][S2].
Pattern tooling is where lost foam behaves differently from every other casting route: a single EPS pattern is consumed per pour, so the "tooling" line is a recurring consumable, not a one-shot capex. Expect pattern fabrication to consume roughly 8-15% of the 10-year spend on a typical job, with the foam pre-expander and pattern mold representing the second-largest single capex block after the furnace [S1][S2].
Variable Cost Drivers: Energy, Sand, and Pattern EPS
Energy is the largest single variable line for a high-volume LFC cell, typically 12-20% of 10-year TCO [S3][S4]. Drivers in order of magnitude: (a) the holding furnace (aluminum melt at 700-760 °C dominates), (b) the sand cooling/reclamation loop moving silica or chromite through classifiers, and (c) the EPS pre-expander using steam.
Sand system cost is the line item most often underestimated. Unbonded silica sand for LFC is reused 50-200 cycles before attrition fines force makeup, and thermal energy to cool return sand back below 80 °C before re-filling is a non-trivial fraction of cell kWh. Chromite or zircon upgrades push the per-tonne sand cost 3-6× silica but extend useful life and reduce thermal-shock defects [S1][S2].
EPS pattern cost responds directly to pattern density: 16-20 kg/m³ foam for non-critical surfaces, 20-24 kg/m³ for dimensionally critical areas, and 24-32 kg/m³ for thin-wall or tight-tolerance sections.
Labor and Indirect: Why LFC Headcount Looks High
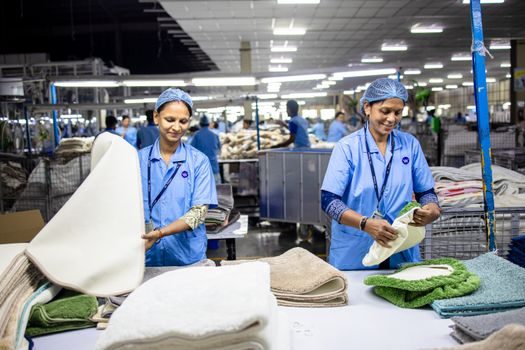
Lost foam has three indirect-cost centers that green-sand does not: pattern assembly and glue stations, foam pattern storage, and the reject-sorting loop for pattern collapse defects. A 2,000-3,000 t/yr aluminum LFC cell typically runs 18-30 direct labor per shift, against 12-18 for an equivalent green-sand molding line [S1][S2].
The labor delta is structural, not a training gap: glue-off for pattern clusters, controlled pattern storage below 25 °C to resist distortion, and 100% pattern inspection all sit between the pre-expander and the pouring line. Buyers evaluating LFC against an automatic molding line for the same annual tonnage should expect a 25-40% headcount premium and budget 5-8% of 10-year TCO for pattern-shop labor alone [S1][S2].
Comparison: LFC vs Green-Sand vs Automatic Molding Line (10-Year TCO Lens)
On the four dimensions procurement actually grades capital equipment on, lost foam, green-sand, and a horizontal-flask automatic molding line line up as follows for 2,000 t/yr of mid-complexity aluminum castings: [S1]
• Pattern/tooling cost: LFC pays EPS per part (recurring), green-sand pays wood/metal pattern boxes (one-shot), automatic molding line pays metal pattern plates (one-shot). LFC wins on part-design flexibility but loses on tooling amortization above ~5,000 pieces per pattern [S1][S2].<br>• Yield and defect cost: LFC typical first-pass yield 88-94% for non-ferrous, against 92-96% for green-sand and 94-97% for an automatic molding line on similar geometry. LFC's defect mix is dominated by pattern-collapse and sand-burn-in; green-sand's is gas and inclusion [S1][S2].<br>• Energy intensity: LFC 12-20% of TCO, green-sand 10-15%, automatic molding line 8-12% — automatic molding wins on energy because it eliminates the EPS vaporization step entirely [S3][S4].<br>• Minimum economic run: LFC's EPS tooling economics turn favorable at 200-800 pieces per pattern; green-sand typically needs 800-2,000 to amortize a wooden pattern; an automatic molding line needs 20,000+ before its metal pattern plate amortizes [S1][S2].
Spec-to-Quote Checkpoints: The Questions That Move the TCO
Three specification questions account for the majority of TCO spread on an LFC RFQ in 2026.
Second, the sand specification and reclamation target. A buyer who specifies silica sand with a 100-cycle reuse target pays a different reclamation system than one who accepts chromite at 200+ cycles.
Buyers should require the supplier to quote energy in kWh/ton of poured metal, not kWh per shift [S1].
Limitations and Failure Modes That Inflate TCO
The five recurring LFC failure modes that drive warranty cost: (1) pattern collapse during pour — controlled by pattern density, coating permeability, and pour rate; (2) sand burn-in — controlled by refractory coating weight (typically 0.8-1.5 kg/m²) and pour temperature; (3) carbon defects from EPS residue — controlled by negative-pressure pour and venting; (4) dimensional drift from pattern aging in storage — controlled by FIFO inventory and climate-controlled pattern storage; (5) hydrogen porosity in aluminum — controlled by melt degassing and pour time below 90 seconds [S2][S5].
Lead time is the silent TCO line: EPS pattern fabrication from a tooling drawing typically runs 4-8 weeks for a new part, against 2-4 weeks for a green-sand pattern box. The pattern lead-time gap is a major reason LFC cells carry pattern inventory worth 30-60 days of production, and that working capital is a real TCO line [S1][S2].
Sourcing, Standards, and the 2026 Vendor Map
American suppliers (NFFS members such as American Foam Cast) typically serve 50-3,000 t/yr aluminum and low-volume iron cells, with ISO 9001:2015 quality systems as the baseline; European and Asian suppliers dominate high-volume automotive LFC, particularly for cylinder heads and crankcase castings [S1]. Independent LFC consulting (e.g. Austin Group) is a recognized route for both greenfield and retrofit cells because the sand-system and pattern-shop integration is where most first-year LFC cells underperform their TCO projection [S2].
Buyers comparing the 10-year TCO of an LFC cell against an automatic molding line should request a per-ton poured cost roll-up (capex amortized over nameplate tonnage, energy kWh/ton, pattern cost per piece, sand makeup per ton poured, and direct labor hours per ton) rather than a single capex figure. The single capex number is the least useful number on the quote. The TCO logic above is consistent with general Total Cost of Ownership frameworks applied to capital equipment, where acquisition cost is typically only 20-40% of the 10-year spend [S3][S4][S6].
For a parallel TCO exercise on a related capital line, the same 10-year driver stack used here is applied in the static pressure molding line TCO driver map and the automatic level TCO breakdown — the structure is the same, the cost lines just shuffle. If the foundry is also sizing an end-of-line cell, the spec-driven classifier for case packing machine types follows the same TCO discipline. Trackable next nodes for an LFC buyer in 2026: (a) per-ton energy quote with kWh/ton basis, (b) pattern density band written into the RFQ, and (c) sand reclamation cycle-count warranty from the sand-system vendor.