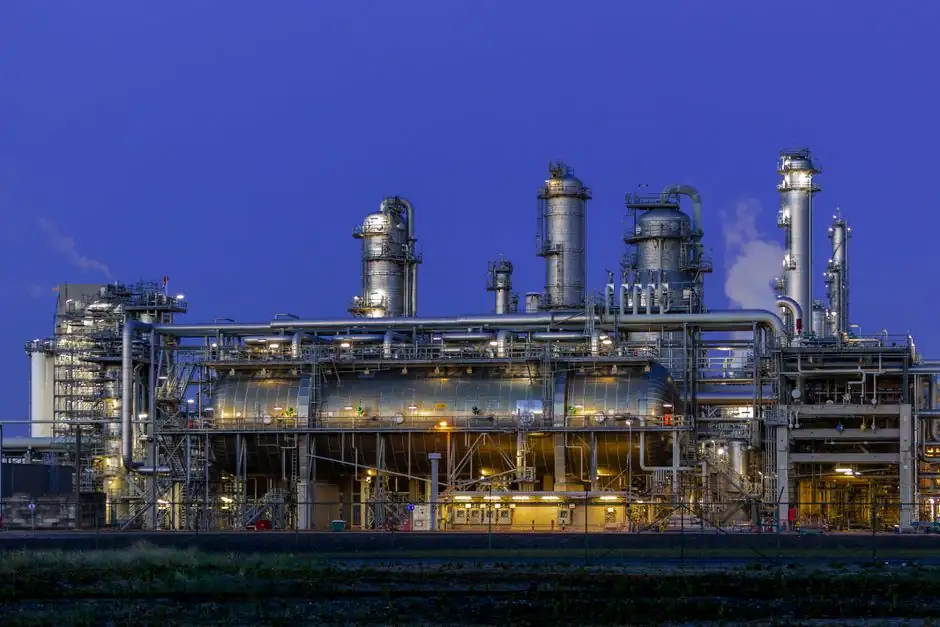
U.S. marketed natural gas production is on track to average 122.5 Bcf/d in 2026, a 4% (4.6 Bcf/d) gain over 2025, with Permian output forecast at 29.2 Bcf/d and Haynesville up 9% year-on-year [S1].
Against that supply, the Henry Hub spot price is forecast to fall 2% to $3.44/MMBtu in 2026, and the average household-facing price still rose 63% from 2024 to 2025, exposing how little upstream economics flow through to the final delivered cost [S1][S3].
Where the dollar actually goes: a four-segment cost stack
Natural gas as a delivered industrial or residential product is not one cost line but four: upstream wellhead production, gathering and processing (midstream), long-haul transport and storage, and end-use combustion or liquefaction, with the three downstream layers typically adding more than the wellhead price itself when fuel reaches a power plant or LNG terminal [S1][S2].
EIA's STEO puts the wellhead benchmark at $3.44/MMBtu in 2026, and an LNG production cost report covering capital investment, utility cost, machinery cost, raw materials, manpower, and transportation confirms that these later cost blocks, not the molecule, dominate the project budget [S1][S2]. For facility-level cost engineering, the practical reference frame is the natural gas processing equipment spec map used in midstream plant design, which sets the cost categories engineering teams actually have to procure.
Upstream economics: breakeven, GOR, and basin cost curves
Upstream cost is basin-specific, with Dallas Fed Energy survey operators reporting 2026 breakeven prices of $69/b (Midland Basin) and $63/b (Delaware Basin) for the Permian, while WTI averaged $84/b through July 2026, leaving the basin comfortably above breakeven and pulling associated gas out of every oil well [S1].
The Permian is oil-driven, so the rising gas-to-oil ratio (GOR) at declining reservoir pressure is a free production tailwind, but the Haynesville, drilled at 10,500–13,500 ft, is gas-driven and Henry-Hub-sensitive, with its proximity to Gulf Coast LNG export terminals and industrial demand keeping economics workable at $3.44/MMBtu [S1]. For 2026, EIA forecasts Haynesville production up 9% (1.3 Bcf/d) and Permian up 6%, putting the molecule at the wellhead for an average of $3.44/MMBtu before any processing, gathering, or transport adder [S1].
Midstream and processing: where the cost is actually built
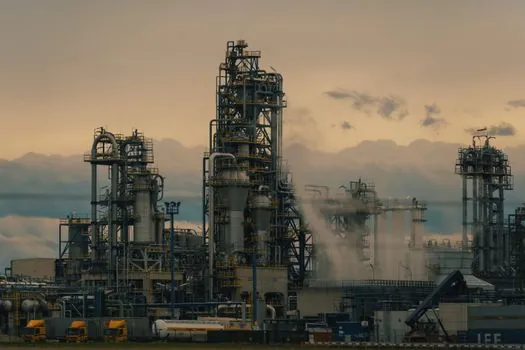
Midstream turns wet raw gas into merchant-quality methane, and the cost drivers are unit operations: amine treating for H2S and CO2, dehydration with molecular sieve or glycol, NGL recovery through cryogenic or Joule-Thomson expansion, fractionation, nitrogen rejection, and mercury removal, each carrying its own capex, utilities, and energy bill [S2].
For LNG specifically, the report-level cost model itemises capital investment, utility cost, machinery cost, raw material requirements, infrastructure, manpower, packaging, and transportation, and plants must pre-treat feed to remove water, CO2, H2S, sulfur, mercury, nitrogen, and heavy hydrocarbons because these freeze at the cryogenic end and damage equipment [S2]. A 2026 study of intensified steam methane reforming reports conventional reforming at $3.77/kg product versus $3.61/kg for the intensified configuration, and lists a 35%+ cost penalty on conventional SMR equipment, illustrating the kind of single-line processing delta that decision-makers should track [S6]. The additive manufacturing material and gas detection product classes feed directly into midstream plant build-out and safety instrumentation budgets.
Transport, storage, and LNG chain cost layers
Transport adds a second priced layer: gathering pipelines from wellhead to processing plant, long-haul transmission lines to city gates or LNG terminals, storage, and regasification, with regasified LNG feeding combined-cycle and open-cycle gas turbine generation for power utilities [S2].
Volumes that do not go by pipeline are liquefied, and LNG is stored close to atmospheric pressure at around minus 162 deg C with a volume reduction to roughly one six-hundredth of the gas phase, which is the ratio that makes overseas shipping economic [S2]. On the export side, U.S. terminals hit capacity in 2025, and the export book is projected to nearly double by the end of the decade, with the 2025 volume alone equal to fuel for about 134 million American households, a scale that has direct implications for domestic delivered prices and gas-fired power costs [S3].
End-use delivered cost: power generation, heating, and industry

At the burner tip, cost is set by three knobs: the commodity price of gas, the conversion efficiency of the boiler or turbine, and the O&M adder. EIA's Sargent & Lundy report for AEO2025 estimated fixed O&M for a combined-cycle plant at roughly $10–12/kW-year in 2023 dollars, and Gas Turbine World's data set sits in the same range, giving specifiers a defensible band for O&M budget lines independent of fuel cost [S8].
Variable fuel cost still rules the dispatch stack: gas-fired plants supply roughly 40% of the U.S. electricity mix, often act as the marginal price-setter in wholesale markets, and pass 100% of fuel cost through to retail customers under utility tariff rules, which is why a 63% consumer gas price rise from 2024 to 2025 can flow straight into retail electricity bills even when wellhead prices are flat [S3]. For comparison, district energy and onsite natural gas boilers show very different O&M profiles, with natural gas plants carrying higher long-run maintenance and repair costs as equipment ages, and district energy requiring little to no O&M budgeting by the customer [S4]. Operators running these systems rely on gas analyzer and gas detector instrumentation to keep combustion and emissions control in spec across the equipment life.
Comparison of cost drivers across the natural-gas value chain
Stacking the four segments against typical cost contribution and volatility, upstream wellhead is roughly 55–70% of the delivered industrial price and tracks WTI and Henry Hub; midstream processing adds 15–25% and is driven by capex amortisation, NGL recovery economics, and utilities like electricity and steam; transport/storage/LNG adds 10–20% and is dominated by pipeline tariffs, liquefaction tolling fees, shipping charter rates, and regasification; end-use conversion adds 5–10% as fixed and variable O&M on the boiler or turbine [S1][S2][S3][S8].
By customer type the same molecule prices very differently: gas-fired power producers pay Henry Hub plus transport and capacity charges with fuel cost fully passthrough; LNG export developers pay Henry Hub or oil-indexed, pay liquefaction tolls of roughly $2–3/MMBtu, and shoulder shipping; industrial users pay city-gate index plus distribution; residential users pay city-gate index plus distribution plus retail margin, with retail rising 63% from 2024 to 2025 versus a much milder wellhead move, evidence that the downstream layers are doing most of the price work [S1][S3]. For process engineers, the procurement-level reference for connector-level cost stacks is in the connector manufacturing cost breakdown, which gives the same itemised capex/utilities/raw-material/manpower treatment for an adjacent industrial product.
Standards, sourcing, and what to watch next

There is no single global standard that prices natural gas; pricing is contractual, with Henry Hub as the U.S. spot benchmark and oil-indexed formulas in long-term LNG contracts, while quality, safety, and emissions compliance sit under separate regimes: LNG specs require very low water, CO2, H2S, sulfur, mercury, nitrogen, and heavy hydrocarbons, with heating value, Wobbe index, and composition as the commercial gates, and combustion-side specs routed through the relevant industrial boiler and gas turbine codes [S1][S2].
Trackable next signals: the EIA STEO releases following August 2026 will print the realised 1H26 average of 121.3 Bcf/d against the 122.5 Bcf/d 2026 forecast; LNG export capacity additions on the U.S. Gulf Coast will reshape Henry Hub versus international parity through 2027–2029; and any sustained move in WTI below the $63–69/b Permian breakeven band will pull Permian associated gas lower and tighten Haynesville's role in supply, with knock-on effects on delivered industrial gas cost [S1]. A useful parallel cost structure for adjacent process plant work is the OEM vs ODM for industrial connectors map, where the same capex/manpower/utilities split applies.