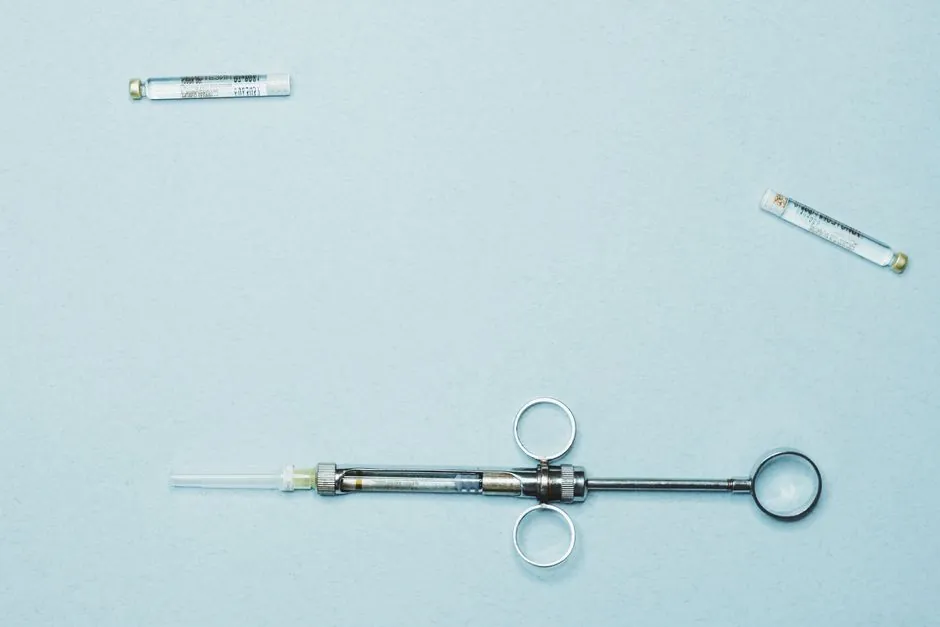
Pharmaceutical manufacturing equipment demand is set to climb from USD 21.24 B in 2026 to USD 30.39 B by 2032 at a 6.2% CAGR, with packaging machines alone holding a 52.4% equipment-type share and liquid-dosage lines logging the highest end-product growth [S1].
Star players in the 2026 lineup are GEA Group Aktiengesellschaft (Germany), IMA Industria Macchine Automatiche S.p.A. (Italy), and Syntegon Technology GmbH (Germany), while MG2 s.r.l. (Italy), Fette Compacting (Germany), and CVC Technologies (US) anchor the specialist/SME tier for capsule filling, tablet compression, and packaging [S1].
How the 2026 Market Slices by Equipment Type and End Product
Packaging machines dominate with a 52.4% share of the pharmaceutical manufacturing equipment market in 2026, followed by formulation-side kit (mixing, granulation, milling, tablet compression, spray drying) and inspection or sterilization ancillaries [S1]. Liquid-dosage lines carry the highest end-product CAGR through 2032, reflecting biologics, sterile injectables, and ophthalmic or nasal formats requiring higher-integrity filling under EMA Annex 1-style containment rules.
Cross-checking against Mordor Intelligence, aseptic fill-finish systems held 29.55% revenue share in 2025 and quality-control and inspection instruments are advancing at 4.85% CAGR through 2031, so the "packaging-plus-inspection" pair is consistently where the dollars sit [S2]. By manufacturing stage, drug-substance production accounted for 36.53% of 2025 spend, while quality-control and release testing is the fastest-growing stage at 5.75% CAGR through 2031 [S2].
Big Pharma vs CDMOs: Who Buys What in 2026
Big Pharma absorbed 42.15% of 2025 pharmaceutical equipment spend, but CDMOs/CMOs are growing faster at 5.82% CAGR over 2026-2031, and CDMOs alone consumed 28% of global bioreactor capacity in 2024 with a projected 38% share by 2028 [S2]. That shift is the single biggest reason modular, single-use assemblies are displacing monolithic stainless-steel installations: validation timelines compress from 18 months to under 6 months for new biologics suites [S2].
On the supply side, the named top tier (GEA, IMA, Syntegon) is the same cluster the industry has cited as "star players" for several years, with MG2, Fette Compacting, and CVC Technologies building the capsule-filling, tablet-press, and packaging niches underneath them [S1]. The competitive map is therefore not a single-vendor race; it is a tiered structure where flow-meter, pressure-transmitter, and construction-machinery specifiers inside pharma EPCs route orders through 2-3 preferred OEMs per equipment class.
Regional Pull: North America Still Leads, Asia Pacific Catches Fast

North America captured 42.52% of the pharmaceutical equipment market in 2025, while Asia-Pacific is the fastest-growing region at 5.12% CAGR through 2031 [S2]. A separate Technavio read puts North America growth contribution at 38.3% of incremental spend over 2025-2030, with packaging equipment the single largest revenue line in 2024 [S3]. The MarketsandMarkets forecast layer, meanwhile, pegs Asia Pacific as the dominant region in its 2026-2032 build, expanding at 6.9% CAGR, and the automatic technology segment growing at 6.6% CAGR over the same window [S1].
Geographically, the decision is no longer "where is the plant" but "where is the fill-finish suite." The European Medicines Agency's Annex 1 revision obliges isolators or restricted-access barrier systems (RABS) across roughly 1,200 European fill-finish suites, a multiyear retrofit backlog that benefits containment-grade lighting equipment and cleanroom build-out suppliers as much as the OEMs named above [S2].
Biologics, Single-Use, and Continuous Manufacturing as the Demand Spine
Biologics commanded 85% of pipeline manufacturing runs in 2024, pushing installed global bioreactor volume from 6.7 million L to an expected 8.9 million L by 2028; viral-vector lines are the bottleneck, with 18-24-month equipment lead times limiting gene-therapy launches [S2]. Rising biologics volumes carry the largest driver impact on CAGR at roughly +1.2%, followed by single-use adoption (+0.9%), GMP-driven equipment upgrades (+0.7%), and CDMO capacity expansion (+0.8%) [S2].
The technology side is firming up: continuous manufacturing lines add about +0.5% to CAGR, and Pharma 4.0 predictive-maintenance retrofits add another +0.4%, with the United States and Germany taking the highest predictive-maintenance retrofit uptake [S2]. The U.S. FDA's fast-track of applications that deploy advanced manufacturing technologies is shortening commercial approval by 6-9 months, accelerating capital spend decisions for anti-static and single-use assemblies in flammable-solvent suites [S2].
Manufacturer Tiering: How to Read the 2026 Competitive Map

The 2026 supplier stack reads cleanly when split three ways. Tier 1 (star players, broad portfolio, global service): GEA Group, IMA, Syntegon Technology [S1]. Tier 2 (specialist/SME, application-specific, fast on customization): MG2 s.r.l., Fette Compacting, CVC Technologies, with documented strength in capsule filling, tablet compression, and packaging lines [S1]. Tier 3 (CDMO-aligned, modular skid integrators and single-use suppliers) is the fastest-growing revenue channel, not because of any single brand, but because CDMO purchasing share is projected to jump from 28% (2024) to 38% (2028) of bioreactor capacity [S2].
For EPC specifiers, the practical rule of thumb in 2026 is: pick Tier 1 for greenfield capacity where global service matters, Tier 2 for solid-dosage lines (especially tablet presses and capsule fillers) where European mechanical engineering still leads, and Tier 3 for biologics suites where single-use and modular skid economics dominate. Independent of vendor, every new fill-finish line in Europe should be evaluated against Annex 1 RABS/isolator obligations, and every new line in the U.S. should be evaluated against FDA advanced-manufacturing designation criteria [S2].
Cross-Source Sanity Check: Where the Forecasts Disagree
Six published 2026 reads do not agree on size, and that is worth flagging upfront. MarketsandMarkets: USD 21.24 B in 2026, USD 30.39 B by 2032, 6.2% CAGR [S1]. Mordor Intelligence: USD 27.10 B in 2026, USD 33.79 B by 2031, 4.51% CAGR [S2]. Technavio: USD 5.88 B incremental growth 2026-2030, 6.1% CAGR [S3]. Market Research Future: USD 53.26 B in 2025 to USD 68.25 B by 2035, 2.51% CAGR, but their scope is wider and bundles laboratory, diagnostic, and quality-control OEMs like Thermo Fisher, Abbott, Becton Dickinson, Siemens Healthineers, GE Healthcare [S4]. Fortune Business Insights: USD 25.14 B in 2026 to USD 46.21 B by 2034, 7.9% CAGR [S5]. Data Bridge (2025-02-10): USD 16.42 B in 2024 to USD 33.72 B by 2033 [S6].
PMMI's shipment-based read is a useful reality check: in 2022, U.S. pharmaceutical machinery shipments were USD 1.1 B, representing 11% of packaging-machinery shipments, so the manufacturing-equipment side is a slice of a much larger packaging-machinery base [S7]. A narrower Meticulous Research scope (processing equipment only) lands at USD 12.85 B by 2029 at 4.2% CAGR, closer to the lower-bound estimates [S8]. Bottom line: any 2026 share number you read off one of these reports is sensitive to scope, so the right move is to lock the segment definitions first (manufacturing-only vs processing-only vs full-stack including lab/diagnostic) before comparing vendor share.
What a Spec-First Buyer Should Track Next
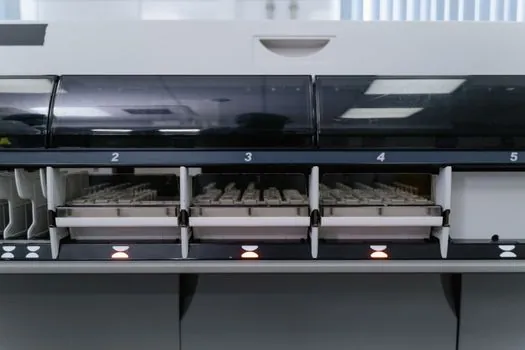
Two signals worth watching into Q4 2026: (1) CDMO bioreactor capacity share, which Mordor reports at 28% in 2024 and projects to reach 38% by 2028, a rise accelerating investment in modular single-use assemblies as suppliers replace monolithic stainless-steel installations [S2]; and (2) the European Annex 1 retrofit backlog, which obliges isolators or restricted-access barrier systems (RABS) across roughly 1,200 European fill-finish suites and is driving a multiyear retrofit cycle [S2]. For cross-process spec context, see the pneumatic valve actuator spec map for pharma and the lithium carbonate line equipment picks as adjacent 2026 reference reads.