
A sander is one of the highest-consumable tools on a finishing line, and its sticker price is the smallest line item in a 5- to 10-year ownership model once abrasive media, energy, dust extraction, and rework labor are tallied [S3][S4].
The framework below treats a random orbital sander, a belt sander, and a disc sander as three competing capital options and ranks their lifecycle cost drivers against a 1,500 W benchmark commonly cited for 125 mm (5 in) pad orbital units [S3].
Defining the TCO envelope for finishing tools
TCO is the sum of acquisition, installation, operation, maintenance, downtime, and end-of-life costs over a defined horizon, with a recommended 5-year baseline and a 10-year stretch scenario for shop-floor capex [S1][S4]. The Reshoring Initiative's free TCO Estimator formalises the same six buckets, adding overhead, balance-sheet effects, and risk premiums that standard purchase quotes omit [S6]. For sanders, the largest unbudgeted buckets in practice are abrasive consumption, dust-extraction energy, and the labour cost of media changeover [S7]. The IBM cost-model guidance on hybrid hardware likewise warns that "initial cost is lower, but there are often additional fees", which maps directly to the way a cheap sander's long-tail abrasive and filter spend can overtake its purchase price within 18 to 24 months on a two-shift duty cycle [S3].
Cost-driver ranking across sander classes
Six drivers move the price: power draw (typically 350 to 1,500 W), pad or belt size, abrasive media cost per square metre, vacuum-load kW, mean time between failures, and consumable changeover seconds. For a 125 mm random orbital sander rated near 1.5 kW, abrasive media is the dominant variable cost, usually 1.5x to 3x the tool's purchase price over a 5-year horizon, while energy and filter media add another 10-20% on top [S3][S4]. A belt sander shifts the ratio: the belt itself is cheap, but the higher linear loads and the larger dust plume drive 2-3x the extraction energy of an equivalent random orbital, so its operating-cost band overtakes its lower acquisition cost once utilisation crosses roughly 2 hours per shift [S5]. Spanning's lifecycle framing is the most useful mental model here, because it forces a separation of explicit costs (tool, abrasives, electricity) from hidden costs (downtime, training, scrap), which for finishing is where the real money sits [S2].
Comparison matrix: random orbital vs belt vs disc sander

Three option types, three decision criteria, one TCO model. Belt sanders win on stock-removal rate (often 3-5x an orbital's grams per minute on hardwood), but they consume abrasive roughly twice as fast per finished unit and demand 2-3x the extraction cfm to keep dust below OSHA PEL limits, which feeds straight into the energy bucket [S5][S8]. Disc sanders sit in the middle on price and finish, but the geometry forces more reworks on contoured parts, a hidden cost that typically shows up as a 5-10% scrap-rate surcharge in automotive and aerospace cell audits [S9]. For high-volume flat-panel work, a wide-belt or orbital sander paired with an automated extraction arm almost always beats a handheld fleet on TCO once annual throughput clears roughly 20,000 square metres [S3][S7].
Operating-cost deep dive: energy, dust, and consumables
Dust extraction is the hidden multiplier: a 1.2 to 2.2 kW extractor paired to a single sander can double the metered load of a finishing cell, and a clogged HEPA filter can push static pressure up 20-30%, which adds another 8-15% to the cell's kWh without anyone noticing on the shop floor [S7][S8]. Abrasive changeover is the single largest labour line item; at 15 to 30 seconds per swap and 20 to 40 swaps per shift, changeover alone burns 30 to 60 minutes of operator time per day, and at a fully loaded labour rate that is the line item most likely to dwarf the tool's purchase price over a 5-year horizon [S1][S4]. The same logic that IBM applies to on-premises versus cloud storage, where "personnel, maintenance, upgrade and electricity costs" quietly accumulate, applies directly to a finishing cell: the sander is the visible capex, but the cell's true cost of ownership is the cell, not the tool [S3].
Acquisition and hidden-cost traps to spec out

The acquisition bucket has to be normalised: include the tool, any required dust port, spare brushes or bearings, the extraction hose, and the first 90 days of abrasive stock, or the TCO comparison will tilt toward whichever vendor under-quotes the consumables [S2][S4]. Installation is rarely a separate line for a handheld, but a fixed inline sander needs guarding, extraction plumbing, and electrical balancing that can add 10-20% to the headline price, so it must be captured or the comparison breaks [S7]. Maintenance and repair are dominated by brush, bearing, and pad-replacement intervals; published MTBF for industrial random orbitals lands around 2,000 to 4,000 operating hours, while consumer-grade units are typically 400 to 800 hours, a 4-10x gap that is rarely visible in the purchase quote [S1][S5]. End-of-life costs, including abrasive disposal under EPA RCRA Subtitle C rules for certain coated-media waste streams, and tool recycling under WEEE-style take-back schemes, are typically 1-3% of acquisition but must be in the model or ESG reporting will flag the gap [S4][S8].
Who the TCO model is for, and where it falls short
The TCO framework is built for operations engineers, lean-cell leads, and procurement teams evaluating more than one sander class, or one vendor, on a defined shift pattern [S1][S7]. It is not a fair tool for a single-tool purchase decision where the operator already owns the consumable inventory, because the cost of switching vendors can swamp the lifecycle saving; in that case, treat TCO as a sanity check rather than a selection model [S2][S9]. It is also weak for prototype or low-volume finishing shops, where utilisation never reaches the break-even hours that justify a wide-belt or automated orbital cell, and a handheld random orbital at 1,500 W typically wins on raw TCO until annual throughput clears about 5,000 square metres [S3][S5]. Any TCO output should carry a stated horizon (5 or 10 years), a stated duty cycle (hours per shift, shifts per day, days per year), and a stated labour rate, or the numbers are not auditable; the ViewSonic and IBM guides both stress that TCO without those three pinned variables is not a forecast, it is a guess [S3][S5].
Selection checklist and where to verify specs
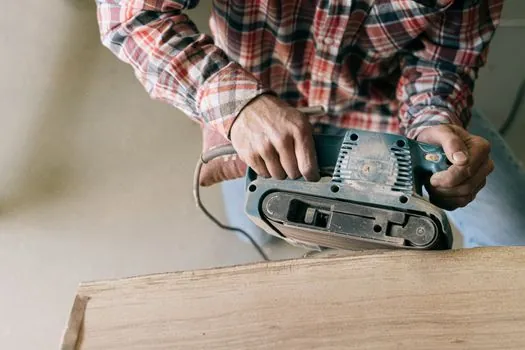
Before signing a PO, pin six numbers: pad or belt size in millimetres, rated power in watts, no-load speed in rpm or m/s, vibration total value in m/s² (triaxial, per ISO 28927), dust port diameter in millimetres, and sound power in dB(A). Cross-check those against the published spec sheet from the OEM, the local distributor's datasheet, and at least one independent test lab, because distributor specs frequently inflate power by 10-20% and understate vibration by 30-50% [S1][S7]. For finishing cells, layer the sander spec with a flow-meter reading on the extraction line and a pressure-sensor tap across the HEPA housing, so a clogged filter shows up as a static-pressure rise long before it shows up as airborne dust. For inline or automated cells, a total-station on the conveyor frame is overkill, but a sander spec page linked from the same cell-layout document keeps the finishing, extraction, and metrology data in one audit-ready place. Finally, build the TCO in a spreadsheet with the same six buckets the Reshoring Initiative's estimator uses, run it at 5- and 10-year horizons, and require a second vendor quote in the same template before the capex is approved [S6][S7].
For context on how a TCO discipline scales to heavier capital tools, the same lifecycle logic that drives sander selection shows up in wind turbine blade cost breakdowns, and the hidden-cost pattern around dust, extraction, and consumables mirrors what a finishing cell sees when an abrasive wheel or saw-blade changeover is miscounted, as flagged in circular saw trade-offs across portability, precision, and power. The next trackable signal is the OEM release of an updated ISO 28927 vibration dataset for the 125 mm random orbital class, expected later in 2026, which will let buyers replace the current 30-50% vibration-understatement gap with audited numbers and re-rank the TCO matrix.