
Industry research puts lifetime energy consumption at 40-90% of a submersible pump's total cost of ownership, often dwarfing the capital line on the quotation [S1]. The global submersible pump market was USD 15.59 billion in 2025 and is estimated at USD 17.21 billion in 2026, on track to USD 28.16 billion by 2031 at a 10.36% CAGR [S5].
For a process engineer sizing a submersible pump for dewatering, borehole supply, or sewage lift, the procurement question is no longer "which unit is cheapest on the PO," it is "which unit has the lowest kWh per cubic metre over its design life." This article breaks the cost drivers down, ranked by typical share, with the engineering numbers you can actually defend in a CAPEX review.
Cost driver ranking: where the money actually goes
A lifecycle cost model sums capital cost, installation, energy, maintenance (parts and labour), and end-of-life disposal, and in most pumping applications energy is the line item that decides the answer [S4][S6]. For submersible units running 4,000-8,000 hours a year on continuous duty, multiple published studies place the energy share inside that 40-90% band, with the upper end reached when a fixed-speed unit is mis-sized or hydraulically mis-matched to the system curve [S1][S3].
The remaining buckets split roughly as: installation and commissioning 5-15%, routine maintenance 5-20%, unplanned repair and downtime 2-10%, and disposal 1-3% [S2][S6]. Capital itself, the number on the vendor quote, frequently ends up at 10-30% of a 10-year TCO. The practical implication: a 15% premium on a high-efficiency stainless-steel borewell unit can be recovered inside 24-36 months on a continuous-run duty, even before maintenance savings are counted [S3].
Three design choices that move the TCO number the most
Duty-point match is the single biggest lever. An oversized submersible running at 40-60% of its best-efficiency flow point burns energy at a steep penalty, because pump power scales with the cube of speed and roughly with flow at part load [S3]. For a typical 50 m³/h, 30 m head sewage or dewatering application, trimming impeller trim or selecting a closer-rated curve typically saves 8-15% on annual kWh without changing the motor [S3][S4].
Drive type is the second lever. Electric drives held 77.65% of submersible pump market share in 2025 and are growing at a 10.89% CAGR to 2031, with variable-speed drives (VSD) increasingly specified on borewell and sewage duty to flatten the part-load efficiency curve [S5]. VFD/VSD retrofit on an existing fixed-speed unit typically cuts energy 20-35% on variable-flow systems (sewage networks, irrigation), with payback inside 18-30 months at commercial tariffs around £0.25/kWh or USD 0.12-0.18/kWh [S3].
Materials and seal design are the third lever, and they move the maintenance line, not the energy line. Borewell units commanded 64.18% of 2025 submersible revenue, with above-100 m head products at 69.25% of market size, both segments where stainless impellers and double mechanical seals materially extend mean time between overhaul [S5]. Standard cast-iron two-stage seals on sewage duty are the budget choice, but typical rebuild intervals of 8,000-12,000 operating hours push lifetime maintenance cost up sharply versus a double-seal stainless build rated for 25,000+ hours [S4][S6].
Comparing the main submersible duty classes on TCO criteria
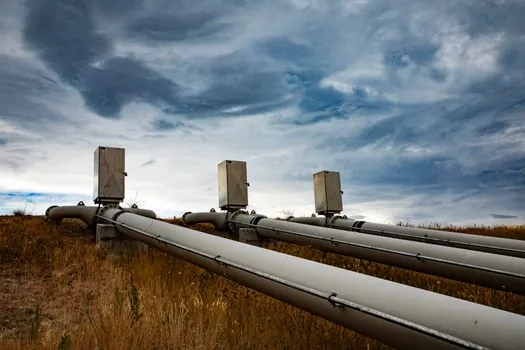
Three duty classes dominate the procurement pipeline: borewell/clean-water, sewage/non-clog, and slurry/dredge. Each behaves differently across the four TCO decision criteria of energy share, maintenance intensity, installation cost, and typical service life [S1][S4][S5].
Borewell submersibles (stainless, 4-10 inch, 50-200 m head range) score low on energy share when properly matched to a VSD, low on maintenance if double-sealed, and high on installation cost because well pulling rigs are expensive. Typical service life is 8-15 years in clean water [S4][S5]. Sewage/non-clog units (cast iron, vortex or grinder hydraulics) score high on energy share because their curves are wide and part-load penalties are steep, and high on maintenance because of ragging and seal wear; installation is moderate. Slurry and dredge submersibles score highest on energy share (low hydraulic efficiency is the trade for solids passage), highest on maintenance (liner, impeller, seal replacement), and lowest on installation cost, with a service life of 3-7 years in abrasive duty [S4][S5].
The cost-engineering takeaway: the spec that wins on TCO is not the same across these three classes. Borewell duty rewards premium hydraulics and VSD; sewage duty rewards a grinder or chopper hydraulics matched to the actual solids loading; slurry duty rewards high-chrome white-iron wear parts and easy liner-swap geometry, because maintenance hours, not energy, dominate the lifecycle spend [S1][S4].
Standards and codes that anchor the lifecycle numbers
Hydraulic efficiency claims on a submersible nameplate are typically tested against ISO 9906 (rotodynamic pumps, hydraulic performance acceptance tests), with energy consumption rates for motors referenced from IEC 60034-30-1 efficiency classes (IE3/IE4/IE5) for the submerged motor can [S3]. Explosion-proof or hazardous-area submersibles for oil and gas, which commanded 75.78% of end-user demand in 2025, are commonly certified to ATEX 2014/34/EU (equipment for explosive atmospheres) with IECEx equivalents for international projects, and to API 610 or ANSI/HI standards for heavy-duty refinery duty where specified [S5].
For drinking-water submersibles, the wetted-path materials need to comply with regional potable-water regulations (in Europe, the relevant framework for materials in contact with drinking water; in the US, NSF/ANSI 61 for drinking water system components is the typical reference). For sewage and wastewater duty, CE-marking under the Machinery Directive and EN 12050 (lifting stations for buildings and sites) are the common reference points when the unit is sold into the European municipal market [S2][S6].
Total-cost-of-ownership pass: installation, energy, maintenance combined
Combine the four lines and the TCO shape becomes visible. Take a 22 kW, 80 m³/h, 30 m head borewell submersible running 6,000 hours a year, a realistic continuous-duty case for a small municipal or agricultural supply [S3][S5]. Capital and installation: roughly 15-25% of 10-year TCO. Energy at 0.12-0.18 USD/kWh and a best-efficiency point of about 78-82% on a premium unit: 50-65% of TCO. Maintenance (one seal and bearing overhaul mid-life, plus routine inspection): 10-20%. End-of-life: under 3%.
The 22 kW example clarifies why the Xylem-led FT Leisure retrofit (Lowara NSCSX 125-250/110/404CCZ, two units) showed annual electricity savings in the thousands of pounds per pump at 8,000 hours and £0.25/kWh; the energy share was the only line big enough to produce that gap [S3].
Limitations and where TCO models can mislead you
A 10-year TCO is only as good as the runtime, tariff, and load-profile inputs, and three failure modes are common [S2][S3]. First, optimistic runtime: many real submersible duty cycles are intermittent (stormwater lift stations, seasonal irrigation), and energy share drops sharply below 3,000 hours a year, which can flip the answer back toward CAPEX on low-runtime duty. Second, ignored downtime cost: sewage and dewatering duty carries a real penalty for unplanned failure, and a single overflow event can exceed several years of energy savings, so redundancy and seal design matter more than the kWh math suggests [S4][S6].
Third, mismatched scope: TCO calculations sometimes exclude disposal, cable replacement (submersible power cables are a known wear item, particularly in sewage duty where ragging damages the drop cable), and the cost of well pulling or barge access for retrieval. A defensible model adds 2-5% for cable, 1-3% for retrieval labour, and 1-3% for disposal at end of life [S1][S6].
Sourcing, standards, and where the market is heading

Procurement teams that anchor their evaluation on capital price and ignore hydraulic match, drive type, and seal design will continue to lock in avoidable OPEX, and suppliers from Xylem to BBP and CNP now publish TCO calculators to make that point visible on a quotation [S1][S3][S6]. Market data shows electric drives at 77.65% share, above-100 m head units at 69.25%, and oil and gas at 75.78% of end-user demand in 2025, while water and wastewater utilities post the fastest projected 11.05% CAGR through 2031, and Asia-Pacific leads at 39.62% of 2025 share and an 11.44% CAGR [S5].
Trackable signals to watch over the next two cycles: VSD and IE5 motor penetration on new borewell tenders, seal-mean-time-between-overhaul data published by submersible OEMs for sewage duty, and whether TCO-style language (energy-share, lifecycle kWh per m³) starts appearing in municipal tender documents instead of pure CAPEX [S3][S5]. For related reading on duty-class trade-offs, see the submersible pump advantages and drawbacks field guide, and for installation details that move the installation-cost line of the TCO model, the self-priming pump installation guide covers the foundation, alignment, and suction-pipe specs that also apply to wet-well submersible stations. A centrifugal pump reference helps when comparing submersible curves against end-suction alternatives, and a diaphragm pump baseline is useful when the duty shifts to chemical or viscous fluids.