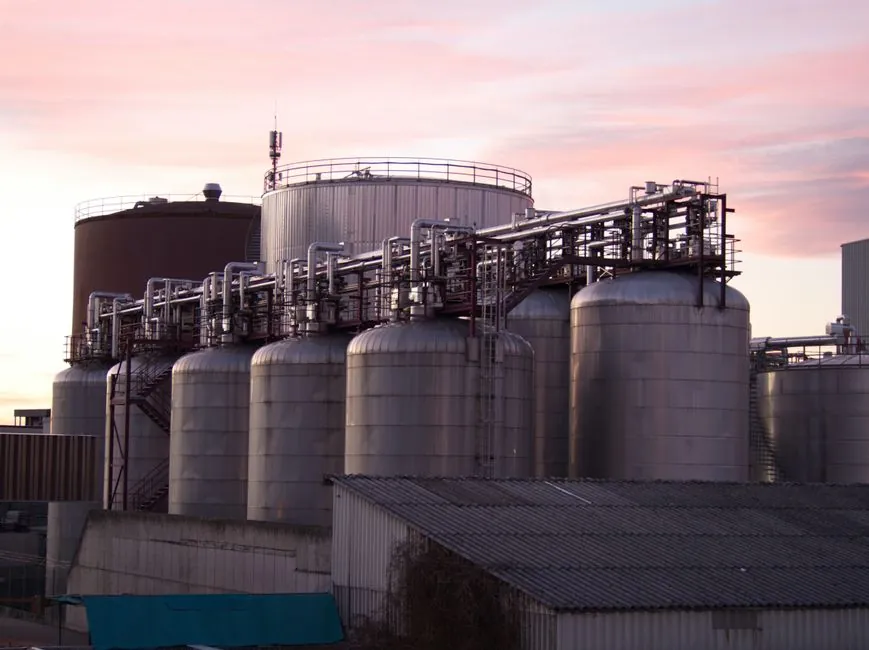
For a standard 20 ft ISO tank with 21,000-26,000 L capacity, the realistic cash outflow per cycle is dominated not by the stainless shell price, but by the cost of getting the unit back to a clean, food-grade or chemical-grade condition before the next load, with tank cleaning machine cycle time and water/energy use directly setting the cleaning line item [S2].
Acquisition and specification: what really moves the headline price
The capital line on a new 20 ft ISO tank container (T11, T14, T50, or T75) is driven by material grade (304 vs 316L stainless), pressure rating (4 bar typical for chemicals, higher for gases), insulation class, and whether the unit is fitted with a flow meter and instrumentation for high-value pharma or specialty chemical service [S2][S7].
A TCO approach beats purchase-price-only comparison because the wrong spec forces a 2-3x markup in operating life: a chemical-grade unit run on food-grade duty loses money on underused spec, while a food-grade unit run on aggressive chemicals fails inspection inside 5-7 years instead of the 15-year nominal life [S4]. Buyers sourcing from Chinese fabricators should lock TIR/IMDG/ADR/RID/CSC plate data plus 316L mill certificates into the contract, a practice that mirrors the spec-discipline approach covered in Copper cathode sourcing from China: 2026 spec, premium, and contract gates, where traceability gates, not headline price, set the real landed cost.
Cleaning, inspection, and certification: the underestimated 15-20%
Cleaning and inspection together typically run 15-20% of TCO over a 15-year asset life, with the figure climbing above 25% for food, pharma, and flavor cargoes that demand heated CIP cycles and allergen-change validation [S2]. A single IBC tank re-validation, including HEPA-filtered drying and ATP swab, can match the per-cycle cost of a tank container cleaning on a per-litre basis, which is why flexitank vs ISO tank comparisons consistently show ISO winning on multi-trip economics despite a 4-6x higher first cost [S2].
The cleaning line item is governed by three levers operators actually control: residual cargo compatibility (switching from a sulfur-bearing to an acid cargo without an intermediate wash step roughly doubles water and chemical use), heating energy input (60-80 deg C wash loops cost 2-3x the energy of ambient loops), and the throughput of the cleaning station (utilities, labour, and waste-handling per unit, often USD 150-400 per standard cycle on a 20 ft unit in European hubs, though no exact figure is in the source material and the range should be treated as industry-typical).
Repositioning and idle time: 10-25% of TCO and the swing factor
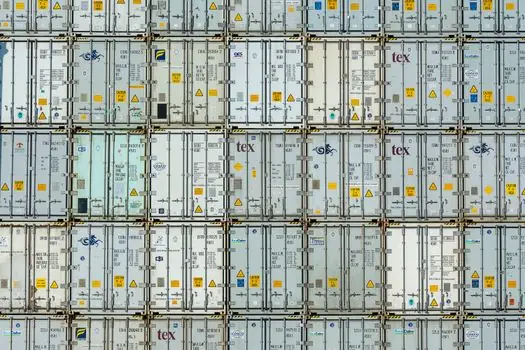
Repositioning, the cost of moving an empty tank from a discharge port back to a load port, is the largest single swing factor in any tank container TCO, ranging from 10% on tight round-trip chemical corridors to 25% or more on one-way lease-and-return flows [S3][S4]. Telematics and pool operators compress this leg by matching empties against backhaul demand, mirroring the route-level benchmark approach used in fleet TCO where per-route, per-vehicle TCO is the actionable unit, not a fleet average [S3].
Two operational choices cut repositioning cost without new capex: pre-clearing the next cargo's compatibility with the previous cargo at the planning desk (avoids 1-2 extra cleaning cycles per year), and contracting depot slots during peak chemical-export windows (avoids 3-7 day queue surcharges that quietly compound into double-digit percent of TCO on Asia-Europe lanes).
Maintenance, repair, and end-of-life residual: 15-25% combined
Maintenance and repair typically run 10-15% of TCO over 15 years, dominated by valve and gasket replacement, manlid seal kits, and pressure-vessel re-test (every 2.5 or 5 years depending on the IMDG/ADR test schedule), with end-of-life residual value at 5-10% of original acquisition depending on shell integrity, CSC plate validity, and scrap stainless pricing [S3][S4].
Decision matrix: which tank type wins on which TCO profile

For a 15-year horizon, ISO tank containers win on TCO when annual trip count exceeds 8-10 round trips and the cargo roster is compatible across product changes; flexitanks win on TCO below that trip count on non-hazardous, single-grade liquid cargoes, while IBC tanks win on short-haul, high-mix, sub-1,000 L per shipment flows where depot return logistics are cheap [S2]. The numbers invert sharply above 12-15 trips per year per unit, where ISO's per-trip cleaning and depreciation amortization flips decisively in its favour.
Use this decision rule of thumb, drawn from the comparative TCO work in [S2]: if the cargo roster has 3 or more compatibility groups (e.g. food oils, phosphoric acid, and a chlorinated solvent) on the same fleet, ISO tank containers beat flexitanks on TCO inside 3 years. If the roster is a single non-hazardous commodity and lanes are point-to-point, flexitanks beat ISO on TCO inside 2 years.
What TCO misses: externalities and the disclosure gap
Standard TCO frameworks under-count external costs, namely accident exposure, congestion, noise, and well-to-tank emissions, which for a 5,500 TEU methanol-fuelled containership ran into the multi-hundred-million-dollar band over 25 years in a published 2024 case study, with the well-to-tank emission leg alone a major share of that gap [S1][S8]. For tank containers, the same blind spot shows up in unpriced empty-leg CO2 and in chemical-cleaning-water treatment that is rarely booked against the unit that caused it.
Operators serious about defensible TCO should add three lines most models miss: empty-leg tonne-km priced at the same freight rate as laden tonne-km, waste-water treatment at the cleaning depot at the tariff actually invoiced to the depot, and a carbon line item at the company-internal shadow price, not the spot market price, since carbon cost is what moves regulatory exposure inside the asset's life, not what it trades at on a given day.
5-year cash flow signals worth tracking
[S3]
For a complete TCO model, the next data points worth pulling are: depot-side CIP cycle time and energy per 20 ft unit at your two highest-volume cleaning stations, the actual empty-leg ratio on each of your top three lanes for the last 12 months, and the 5-year CSC plate renewal backlog at your operator, since plate expiry forces a one-off capex spike that should be smoothed into the model, not absorbed as a surprise [S2][S4].