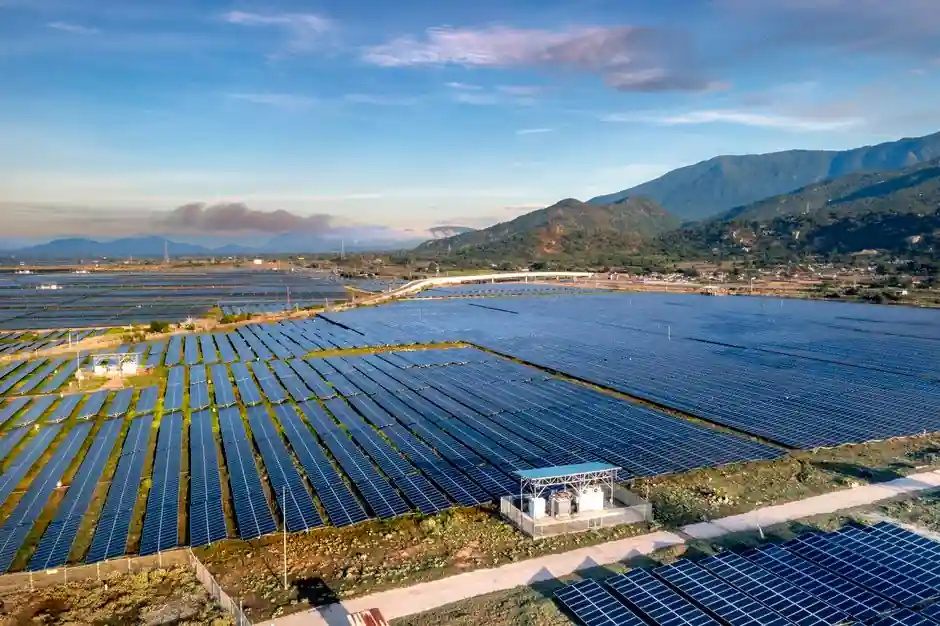
U.S. large power transformer lead times now routinely stretch 128 to 144 weeks for standard utility units and 30 to 160+ weeks across MVA classes, against a pre-shortage baseline closer to 26 to 52 weeks [S3][S7]. The bottleneck is no longer a procurement nuisance; it is a binding constraint on a 2,600 GW interconnection queue, where nearly 80% of projects now withdraw before commercial operation [S2].
The problem is structural, not cyclical. U.S. power transformer demand climbed 119% since 2019, prices rose roughly 75% over the same period, and conductor costs for power lines have doubled since 2019 [S5][S6]. Nearly 2,300 GW of generation and storage sat in interconnection queues at the end of 2024, while the average U.S. transformer is more than 33 years old and roughly 40 million distribution units have exceeded useful service life [S4][S5].
What the 2,600 GW Backlog Actually Means in Dollars and Megawatts
Interconnection queue volume grew from 1,400 GW in 2021 to over 2,000 GW by 2024, then swelled to 2,600 GW by 2025-2026, with median time to commercial operation now approaching five years [S2]. For data center operators, transmission connection lead times have stretched to 12 years in some MISO and PJM zones, which is now a board-level constraint on hyperscale buildout [S2].
The financial damage is concrete: a single PJM capacity auction failure to clear new, cheaper generation cost consumers an estimated $7 billion in 2025, and interconnection-related network upgrade costs now represent 30-37% of total project cost for withdrawn projects versus 6-8% for those that reach COD [S2]. Withdrawal rates on projects entering the queue in 2025 approach 80%, compared to a historical 20% completion rate for projects that entered between 2000 and 2018 [S2]. The power distribution chain upstream of every project is the same chain the transformer shortage is choking.
Where the Bottleneck Actually Lives Inside the Transformer
Demand is real, but the "transformer shortage" framing collapses several distinct sub-supply chains into one, which is the source of much of the misallocation [S5]. A unit transformer is a stack of separate supply chains: the electrical side covers CRGO (cold-rolled grain-oriented) steel laminations, copper and aluminum windings, magnetic assemblies, and OEM-controlled electrical systems; the mechanical side covers tank bodies, conservators, cooling radiators, terminal connectors, OLTC enclosures, oil valves, pressure-relief housings, and bushing flanges [S5].
The critical path runs through CRGO steel, winding capacity, and a "batch-of-one" manufacturing dynamic driven by fragmented utility specifications, so most units are effectively bespoke and resist automation [S4][S5]. Mechanical-side items (tanks, fittings, brackets) move through casting, machining, and global fabrication networks with completely different suppliers and lead times, and frequently wait for the electrical bottleneck to clear even when they do not have to [S5]. A power transformer program, in practice, is several decoupled production lines that the industry is managing as one.
Why Capital Cannot Scale the Fix on Its Own
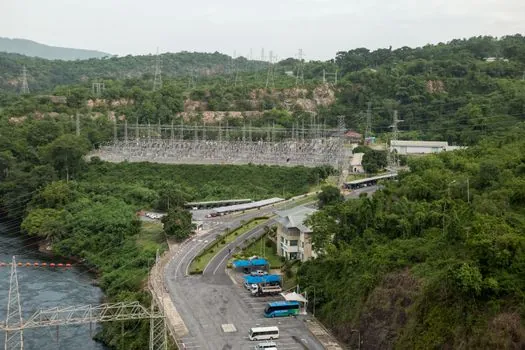
Investor-owned utilities are expected to deploy more than $1.1 trillion across grid and generation infrastructure between 2025 and 2029, nearly matching the $1.3 trillion invested over the prior decade, yet the pace of expansion is now constrained by equipment availability, not funding [S4]. LPT manufacturing is precision-dependent: coil winding, core assembly, and extensive testing all require skilled labor and long lead times, so capacity additions are incremental, not exponential [S4].
Three structural factors prevent rapid scaling: low production volumes tied to cyclical demand history, dependence on specialized inputs (CRGO steel, high-grade winding copper, transformer oil), and bespoke utility specs that suppress throughput [S4]. The U.S. is also import-dependent on finished large power transformers and on key subcomponents, and domestic winding capacity is concentrated in a small number of plants with long order books [S4]. More capital buys more orders; it does not buy more winding stations, more CRGO lamination lines, or more qualified winding crews. The power cable side of the same problem has doubled in cost since 2019, and transformer prices are up roughly 75% [S6].
Comparison: Real LPT Lead Times, Prices, and Constraints Across the 2026 Market
Lead times and prices diverge sharply by MVA class, voltage class, and subcomponent, which is why "transformer shortage" is the wrong unit of analysis: [S4]
- Standard large power transformer (100+ MVA, transmission): 128 to 144 weeks lead time in 2026, versus 26 to 52 weeks pre-shortage; 75% price increase since 2019 [S3][S6]. <br>- Distribution transformer (< 10 MVA): 10% supply deficit projected by 2025, with cost up roughly 60% since 2019 and lead times commonly 52 to 80 weeks [S7]. <br>- Subcomponents: CRGO steel and winding capacity are the critical path; tank fabrications, radiator assemblies, and bushing flanges routinely sit on shorter, independent lead times but are scheduled against the electrical bottleneck [S4][S5]. <br>- Domestic vs imported: U.S. LPT manufacturing capacity is concentrated in a handful of plants; import dependence on finished units and on key subcomponents such as wound cores and high-voltage bushings remains a structural vulnerability [S4].
Specifying engineers should treat LPT procurement as a 30-month minimum project on a 100+ MVA unit, lock in slot reservations 18 to 24 months ahead of breaker-energization dates, and qualify at least two domestic suppliers plus one import source for any unit above 50 MVA.
What Renewable Developers and Utilities Are Doing About It

Three tracks are open. First, queue reform: PJM, CAISO, and MISO are moving from first-come, first-served study processes to cluster studies, withdrawal penalties, and readiness scoring, which mechanically reduces the 80% withdrawal churn by raising the cost of speculative applications [S2]. Second, fleet management: utilities are extending the service life of existing units through remanufactured windings, upgraded cooling, and dissolved-gas-analysis monitoring, while running transformers closer to nameplate rating with dynamic thermal ratings [S4].
Third, standardization: there is a slow but real push toward a smaller set of utility-approved standard designs, which would cut the "batch-of-one" overhead and raise throughput per lamination line and per winding station [S4]. Hyperscale data center operators, including Google, are signing multi-year reservation agreements directly with transformer OEMs to lock in 2027-2028 slot capacity before interconnection studies complete [S2]. The same pattern is repeating in air impact wrench-class industrial tools: when the bottleneck is real, the answer is reserving slots 18 months ahead, not waiting for spot capacity.
Limits of the Fix and Failure Modes to Watch
Cluster studies and withdrawal penalties reduce the queue, but they do not add a single winding station. Standardization helps throughput, but only if utilities accept common specs, which is a procurement-culture problem, not a manufacturing one [S4]. Life extension buys 5 to 15 years on individual units, but a fleet with an average age over 33 years has very little slack left, and one major in-service failure removes 800 MVA to 1,500 MVA of step-up capacity from the system at a time when 2,600 GW is waiting to connect [S2][S5].
The failure mode to watch is correlated fleet aging: a large percentage of U.S. transformers were built in two waves (mid-1960s and late-1970s), and they fail in clusters, which can collide with the renewable buildout window [S5]. For a detailed breakdown of the lead-time bands by MVA class, see the Power Transformer Lead Times 2026: 128 to 144 Weeks Versus Pre-Shortage Baseline reference, the Power Transformer Lead Times in 2026: 30 to 160+ Weeks by MVA Class MVA-class table, and the import-dependence analysis in U.S. Large Power Transformer Import Dependence and Domestic Winding Capacity in 2026. Procurement teams should also track the 2026 demand picture in Power Transformer Demand Outpaces Capacity Through 2026.
Trackable signals through Q4 2026 and into 2027: (1) the next PJM, CAISO, and MISO cluster-study results, which will reveal whether the 80% withdrawal rate drops toward the historical 20% baseline; (2) announced U.S. CRGO lamination and winding-capacity additions, which historically have required 24 to 36 months from greenfield to qualified production; (3) hyperscale data center interconnection filings, which are the leading indicator for how far the 12-year worst-case transmission lead time is moving. Until the LPT and winding capacity actually expand, capital deployment and renewable interconnection throughput will continue to diverge.