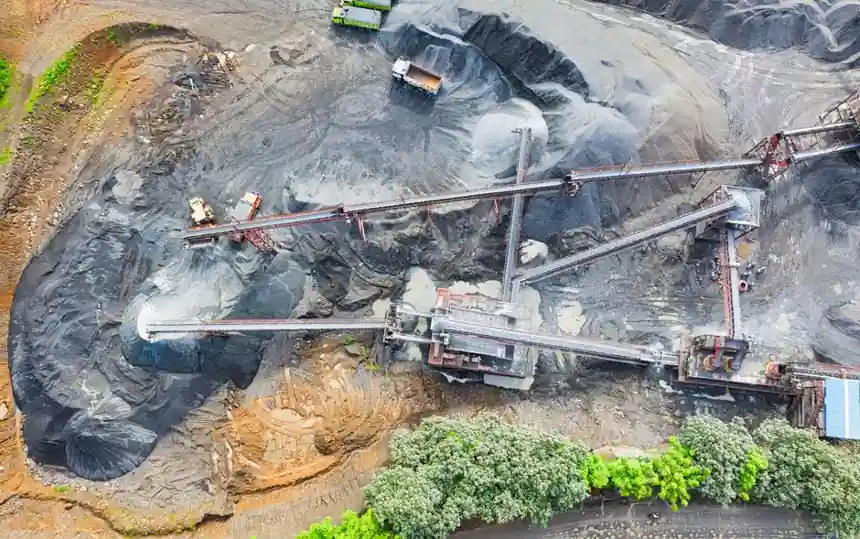
Ammonium paratungstate (APT) CIF prices rose from US$83/kg WO3 in January 2026 to US$340/kg WO3 in July 2026, a 310% increase in seven months and one of the sharpest single-commodity rallies of 2026 [S1][S2].
Global first-use tungsten demand is forecast to rise from approximately 162,000 t WO3 in 2025 to 180,000 t in 2030 and 202,000 t by 2035, while China produced 67,000 t of the 85,000 t mined globally in 2025 and controls about 85% of APT refining capacity [S2].
Where the 2026 demand is actually coming from
First-use demand splits between defense and industrial end uses, with armor-piercing munitions, tank armor and rocket components forming the military block, and machine tools, drilling equipment, and wear-resistant parts driving the industrial block [S3].
European and North American machine-tool builders in Germany, Sweden and Japan are paying premiums to lock in non-Chinese tungsten, on the rationale that sudden Chinese export disruption would halt their own production lines [S3]. The military demand line is now policy-driven: U.S. Department of Defense procurement rules scheduled to take effect on January 1, 2027 will prohibit defense contractors from sourcing tungsten metal powder and heavy alloys from China and other designated countries [S1].
Tungsten is also closely tied to industrial automation. Cutting tools, drill bits, and high-temperature furnace components feed directly into plants that run industrial valve assemblies, flow meter calibration rigs, and pressure transmitter test stands, so any sustained tungsten tightness propagates into instrumentation lead times, not just munitions output.
2025-2030 demand forecast: numbers and the ex-China gap
Global first-use tungsten demand is forecast to rise from approximately 162,000 tonnes WO₃ in 2025 to 180,000 tonnes in 2030 and 202,000 tonnes by 2035, according to a new S&P Global report [S2].
Ex-China primary demand in 2030 is projected at roughly 50,000 t WO3 after recycling, against accessible ex-China mine supply of 34,000 t WO3 even if all 11 announced projects land on schedule, leaving a structural 16,000 t WO3 gap [S2]. That means accessible ex-China mines will meet only about 68% of projected ex-China primary demand in 2030 [S2]. China holds about half of reported global tungsten ore reserves but produces roughly 80% of current mine output, a concentration that puts the supply curve at the mercy of Beijing's export licensing [S1].
A direct comparison of the demand cases shows the asymmetry buyers face: 2025 demand 162 kt, 2030 demand 180 kt (+11.1%), 2035 demand 202 kt (+24.7% vs 2025); ex-China mine supply ceiling 34 kt vs ex-China demand 50 kt in 2030; APT price January 2026 US$83/kg WO3 vs July 2026 US$340/kg WO3, a 310% rise in seven months [S1][S2].
Price levels, cost-curve signals, and the new APT floor
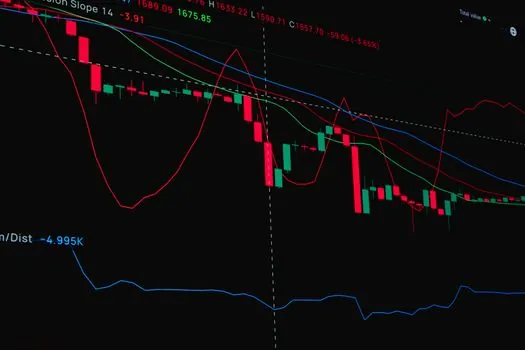
Independent S&P Global modelling places the cost band that supports more than 85% of accessible current and proposed ex-China supply at US$36-48/kg WO3 in 2028, while a structural price of about US$90/kg WO3 would support every project in the modelled pipeline [S2].
Against that, the July 2026 spot of US$340/kg WO3 has already cleared the economic hurdle for most new ex-China supply; the binding constraints are now financing, permitting, construction, commissioning, and downstream qualification, not the underlying price signal [S2]. Independent observers have flagged a possible move past US$460/MTU in 2026, with US$400-450/MTU cited as a candidate floor for 2026-2027, well above the 2023 trough near US$312/MTU [S3] (2025-05). For the U.S. end-market, a 25% tariff on Chinese tungsten imports was already in place from August 2024, on top of Beijing's December 2024 dual-use technology export restrictions [S3] (2025-05).
One concrete datapoint anchors the financing picture: a tungsten mine can take 16-30 years from greenfield discovery to first concentrate, which is why long-term offtakes, government procurement and critical-mineral price mechanisms are increasingly used to bridge the next price cycle rather than relying on spot alone [S2].
Ex-China project pipeline: who is actually building
Eleven announced mine projects are forecast to add nearly 20,000 t of annual capacity by 2030, but the lead projects are concentrated in a handful of jurisdictions [S2].
Sangdong in South Korea, operated by Almonty Industries, began processing stockpiled ore in June 2026; Phase I is designed for approximately 2,300 t of tungsten concentrate per year, with the longer-term ramp positioned to deliver about 7% of global supply at full output [S2][S3] (2025-05). At Hemerdon in the UK, Tungsten West started phased commissioning in July 2026, with full commissioning targeted for Q1 2027 [S2]. Mt Carbine in Australia saw EQ Resources approve an A$39 million expansion to roughly double crushing capacity and add approximately 500 t WO3 of annual production [S2].
Outside those, Northern Katpar in Kazakhstan moved into feasibility work under a Tau-Ken Samruk and Cove Capital joint venture tied to an approximately US$1.1 billion tungsten mining and processing package [S2]. European brownfield sites are also gaining weight: Panasqueira in Portugal (Almonty) and Barruecopardo in Spain (EQ Resources) are cited as linchpins of non-Chinese supply, with U.S. projects including Guardian Metal Resources' Pilot Mountain and Tempiute still in earlier development [S3] (2025-05).
Risks, constraints, and what could still break the forecast
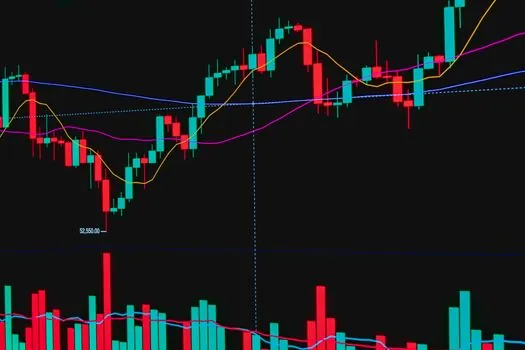
Three failure modes dominate. First, execution risk: S&P Global's 16,000 t 2030 deficit assumes every announced project delivers on schedule, and a single slip of 12-18 months in commissioning at Sangdong or Hemerdon alone would widen the gap [S1][S2].
Second, downstream qualification: defense and aerospace tungsten powder must clear traceability and specification audits before it can replace Chinese supply in U.S. DoD contracts after January 1, 2027, a process that is independent of mine output [S1]. Third, demand elasticity: a sharper-than-expected slowdown in machine-tool or construction equipment output would pull the demand line down, but the military floor is largely policy-insulated, so the downside on volume is narrower than the upside risk on price [S3] (2025-05).
Trackable signals to watch: Sangdong Phase I ramp rate vs the 2,300 t/yr design point; Hemerdon full-commissioning slippage past Q1 2027; U.S. DoD list of approved non-Chinese tungsten powder suppliers after the January 2027 cutoff; and any APT spot move through the US$400-450/MTU band cited as the candidate 2026-2027 floor [S1][S2][S3] (2025-05). A useful cross-read for buyers is how tungsten tightness flows into the broader metals stack that underpins factory automation, where procurement teams already juggle servo motor and PLC lead times against shifting critical-mineral flows.
See also our earlier report, OEM vs ODM for warehouse robotics: a spec-driven decision framework.