
China and the United States remain the two anchor points of global UPS manufacturing capacity, with Asia-Pacific absorbing roughly 30% of 2025 demand and China plus Japan plus India plus South Korea plus Southeast Asia as the dominant consumption cluster [S3].
The total addressable UPS market sits at US$9.13 billion in 2025 and is projected to reach US$14.48 billion by 2034, a 5.26% CAGR, with the industrial sub-segment alone growing from US$6.6 billion in 2024 toward US$12.2 billion by 2034 at 6.3% [S2][S4]. The industrial UPS category is now the single most relevant lens for readers who care about country-level capacity, because utility-grade and process-line ratings concentrate in that slice.
Country-by-Country Capacity Weighting
North America holds 42.3% of the industrial UPS segment by value, equal to about US$2.7 billion, making the United States the largest single-country revenue pool even though China dominates unit shipments [S4]. Asia-Pacific's 30% share of 2025 demand covers China, Japan, India, South Korea, and the Southeast Asian cluster, and that share is expanding faster than the global average as data-center build-outs concentrate in Malaysia, Indonesia, and India [S3].
Germany has historically been the third-largest European UPS production base, adding over US$153.8 million in incremental demand over a five-year window in earlier reporting, and Japan remains the second-largest single national UPS market in Asia with the up-to-5 kVA band alone reaching US$282.9 million by 2025 [S5 (2020-02)]. The up-to-5 kVA sub-segment is the volume backbone of global UPS output, projected at over US$5.9 billion by 2025 and growing above the 5.1% blended rate [S5 (2020-02)].
Modular and Lithium-Ion Lines Are Reshaping the Mix
The global modular UPS market is valued at US$2.00 billion in 2026 and is projected to reach US$4.05 billion by 2034, effectively doubling inside eight years, which is faster than the broader UPS market's 5.26% CAGR [S1]. Modular architectures are favoured by hyperscale data-center operators because they allow N+1 redundancy on a shared bus and let operators swap power modules without a planned shutdown, a feature now standard in European and U.S. tier-III-plus specifications.
Online and double-conversion UPS already hold 58.1% of the industrial segment by type, and systems rated above 500 kVA lead with 44.9% of total revenue, which means most incremental factory capacity in China, the U.S., and Germany is being commissioned at the 500 kVA-to-multi-MW scale [S4]. The ASRS system and automated warehouse segments are a key downstream pull for this rating band, because each retrieval crane and conveyor cluster needs conditioned power with a transfer time inside 2-10 milliseconds.
Standards and the Production Engineering Floor
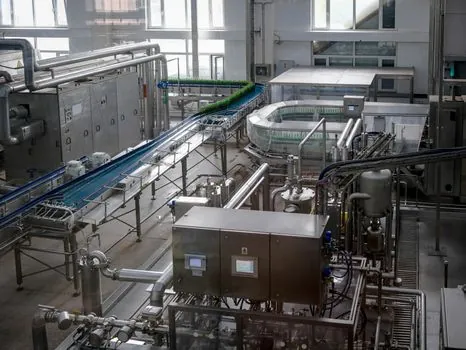
Online double-conversion units regulate output voltage within 2-3%, materially tighter than line-interactive units at plus or minus 8-15%, and IEEE power quality standards form the reference floor most factories cite when qualifying Chinese and European suppliers [S4]. Output is delivered at standard 120 V and 230 V rails, and the 230 V single-phase is the de-facto production common in EU and Asian plants, while 120 V dominates the North American SKU mix.
Typical industrial three-phase online units now ship in the 3 kVA to 250 kVA band as a baseline procurement range, with 60 kVA and 100 kVA being the most quoted sweet-spot ratings for institutional and process-line buyers, and ratings above 500 kVA representing the high end of new factory output [S4]. Buyers who need to spec a sprinkler system backup or a shuttle system control cabinet alongside a UPS should match the UPS kVA rating to the largest inrush load, typically 1.25-1.5x continuous nameplate for motor-driven fire pumps and conveyor drives.
Comparison: China vs United States vs Germany vs Japan vs India
Across five decision criteria the country picture looks like this. Manufacturing volume (units shipped): China leads on unit count, with East Group, KSTAR, Kehua Hengsheng, and Huawei anchoring domestic fabs [S5 (2020-02)]. Revenue pool size: the United States leads with 42.3% of industrial UPS value at roughly US$2.7 billion [S4]. Engineering depth and grid-grade kVA: Germany and Japan lead, with Piller and Fuji Electric in the rotation-proof segment, and ABB plus Siemens serving utility and rail loads [S5 (2020-02)]. Low-voltage (<= 5 kVA) consumer and SMB output: China plus Japan dominate, with the up-to-5 kVA band alone valued at over US$5.9 billion by 2025 [S5 (2020-02)]. Modular-data-center growth: China plus the United States are co-leaders, jointly accounting for 74.6% of global battery energy storage capacity by 2030, a direct upstream input to lithium-ion UPS lines [S2].
Who Country Capacity Is For, and Who It Is Not

Country-level UPS capacity is most relevant for procurement teams sizing multi-MVA data-center halls, industrial EPCs building sorting system and conveyor backbones, and integrators bidding on UPW system trains for semiconductor fabs, all of whom care about 500 kVA-plus availability and modular lead times. [S4]
It is less relevant for residential buyers, who sit squarely in the up-to-5 kVA band where brand and warranty dominate the decision, and for buyers in regions with unstable grids above 10% outage time, where the right answer is often a hybrid UPS-plus-diesel architecture rather than a higher-kVA unit. A respirator sizing and selection walkthrough or a stud welder safety review is a better procurement guide for those categories, because UPS framing does not help there.
Limits, Failure Modes, and Sourcing Risks
Three constraints matter for country-level sourcing. First, raw-material price volatility for lithium, lead, and copper still moves the bill of materials, and Chinese modular suppliers have been the fastest to absorb these swings [S5 (2020-02)]. Second, unorganised regional assemblers undercut on price but fail double-conversion IEEE transfer-time tests, so spec audits above 500 kVA should require factory test reports, not just datasheets. Third, lead time for above-500 kVA frames in 2026 is reported in the 12-20 week range from European and Japanese OEMs, versus 6-10 weeks from Chinese modular vendors, a gap that often decides the bid. [S4]
Sourcing Standards and Next Signals to Watch
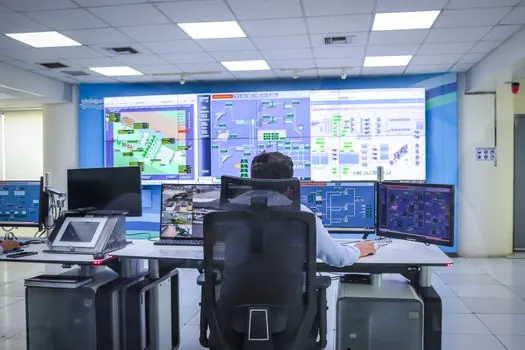
Cross-reference any country-level bid against IEEE 519 for power quality, IEC 62040 for UPS performance, and UL 1778 for North American safety listing, then verify the double-conversion transfer-time claim against a factory test certificate rather than marketing collateral [S4]. Buyers targeting the modular band should also confirm hot-swap module compatibility and the firmware path for lithium-ion retrofit, since the 2026 industrial laser market and the cold chamber die casting machine inspection categories show the same pattern, where buyers who skip the firmware audit absorb the risk later.
Two signals to track next: the BESS capacity buildout, projected to grow sixfold between 2025 and 2030 at a 42% CAGR, which directly expands the lithium-ion supply that Chinese and U.S. UPS lines depend on [S2], and the share-shift inside the >500 kVA band as Chinese modular vendors push into European utility and rail tenders that German and Japanese OEMs historically held.