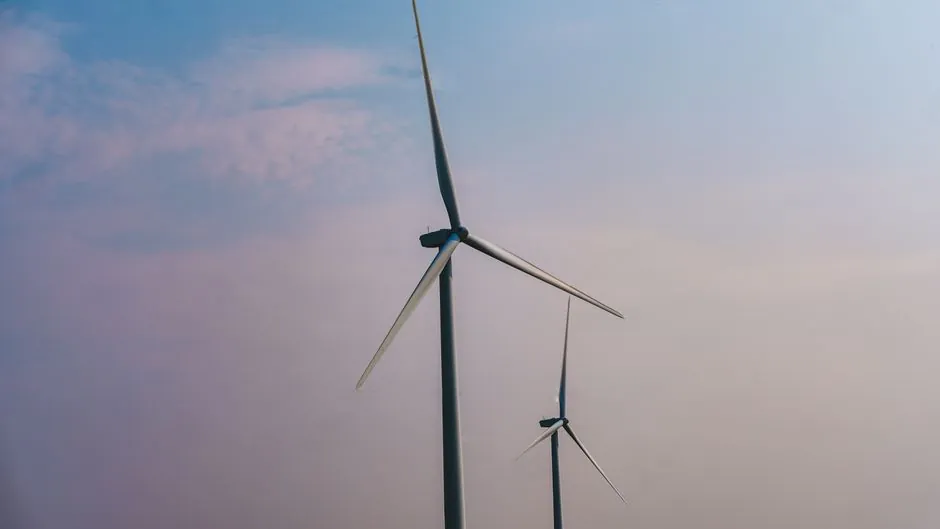
Fifteen wind turbine manufacturers accounted for 95% of global installations in 2025, with Chinese suppliers expanding from 30% share in 2017 to roughly 70% in 2025 on the back of a 30% labour-cost advantage [S3].
Global wind additions rose more than 30% to over 165 GW in 2025, of which China alone installed 127 GW, equal to about 80% of the world total, while ex-China installations continued to decline [S3].
Manufacturer concentration at the turbine OEM level
The global wind turbine market is moderately concentrated, with a Herfindahl-Hirschman Index near 830 and a top-five share of just over 50% in 2025 [S3]. That same year, the European segment alone saw Danish, German and Spanish suppliers hold 94.5% share, up 2.5 points year on year, while five OEMs exceeded 100 GW of cumulative installed capacity worldwide [S8].
Chinese entrants now comprise around 70% of the global market, versus roughly 30% eight years earlier, and their share gain is anchored in manufacturing cost rather than subsidies: a 100 m blade requires about 2,700 man-hours, priced at roughly $50/h in the West and $7/h in China, while ocean freight from China to Europe runs near $20k per blade on a $200k/day vessel, less than 4% of manufacturing cost [S3].
Blade segment: the leading three control over a third
Within the rotor-blade sub-market, LM Wind Power, TPI Composites and Siemens Gamesa jointly held more than 35% of 2025 share, a level Mordor Intelligence describes as moderate consolidation rather than the tight oligopoly seen at the turbine OEM level [S4]. The wider top-20 ranking published by Spherical Insights confirms that Vestas, GE Renewable Energy, Enercon and Mingyang also sit in the leading cohort alongside the three blade specialists [S5].
Asia-Pacific commanded 52.40% of global rotor-blade revenue in 2025, the Middle East and Africa are forecast to grow fastest at a 28.15% CAGR to 2031, and the market overall is projected to expand from USD 50.62 billion in 2025 to USD 87.86 billion by 2031 at a 9.62% CAGR [S4]. A separate sizing by Spherical Insights puts the 2025 base lower, at USD 25.74 billion rising to USD 58.92 billion by 2035 at 8.63% CAGR, reflecting different scope definitions between the two trackers [S5].
Blade length, material and process mix in 2025
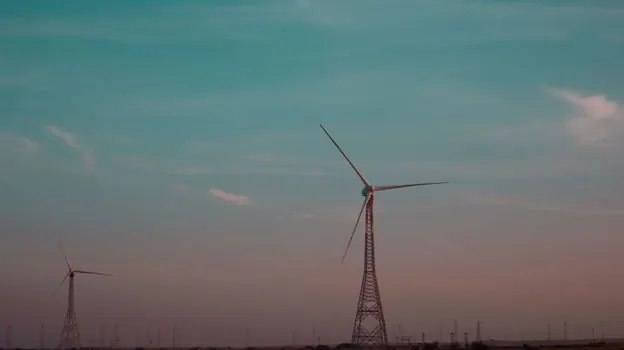
Onshore deployment still dominates the blade demand mix at 82.35% share in 2025, while offshore blades are forecast to grow at 29.9% CAGR through 2031, with most new Chinese offshore projects now specifying 15 MW turbines that need blades over 100 m [S4]. By length, the 61-75 m band led with 44.30% of 2025 blade market value, and blades above 75 m are advancing at 12.85% CAGR, the fastest length category [S4].
Carbon fibre captured 47.50% of blade material share in 2025, with hybrid composites forecast at a 10.39% growth rate, while vacuum infusion accounted for 59.10% of production volume and prepreg lines are accelerating at 10.24% CAGR for tighter-tolerance offshore blades [S4]. U.S. supply infrastructure supports this: more than 500 domestic manufacturing facilities specialise in wind components such as blades and towers, and NREL's CoMET facility is scaling thermoplastic-resin and thermal-welded joining work aimed at recyclable, larger, lighter blades [S1][S2].
Margins, pricing pressure and offshore drivers
OEM margins have stayed compressed: Vestas averaged 4.8% over the past decade, and the broader industry has had to reinvent its product line every two to three years as turbine ratings climb, raising both engineering and warranty exposure [S3]. Mordor Intelligence quantifies the demand drivers: rapid scale-up of above-5 MW turbines in Chinese coastal provinces adds roughly +1.5 percentage points to the CAGR forecast, U.S. Inflation Reduction Act production tax credits contribute +1.2 points, and EU REPowerEU repowering of post-2010 onshore fleets adds +0.8 points [S4].
Modular 70 m+ blade formats and floating-offshore demonstrators transitioning to serial 100 m orders add a further +1.0 point combined, with OEM-side pressure to segment blades to overcome road-haul limits flagged as a structural rather than cyclical constraint [S4]. Patent activity from traditional energy majors, including ABB, Aker, BP, Chevron, Eni, Equinor, ExxonMobil, Shell, Siemens and Technip, signals continued new-entrant pressure on the offshore wind segment [S3].
Selection criteria for buyers and specifiers
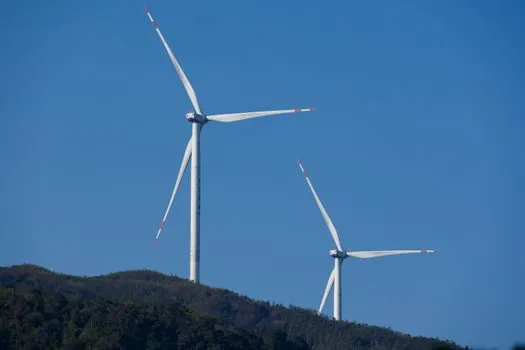
Procurement teams sizing blade supply should anchor on four criteria: blade length band (40-60 m, 61-75 m, above 75 m), material system (carbon fibre, glass fibre, hybrid composite), manufacturing process (vacuum infusion vs prepreg), and regional supply-chain depth [S4]. The 61-75 m class carries the largest 2025 value share at 44.30%, but above-75 m is the fastest-growing at 12.85% CAGR, so a 2026 spec that locks in sub-60 m blades only effectively bets against the offshore pipeline [S4].
For onshore projects needing road-transportable blades, the 40-60 m class remains a low-risk baseline; for offshore or repowering work in Europe, where GWEC recorded a 2.5-point share gain for Danish, German and Spanish suppliers, prioritising suppliers with documented prepreg capacity and lightning-protection track records reduces lifetime maintenance risk [S4][S8]. Operators tracking structural-health data on installed blades increasingly pair blade selection with pressure transmitter and flow meter retrofits on the tower base, since SCADA-grade blade load data is now a standard input to lifetime extension cases.
Constraints, failure modes and recycling
Recyclability is the headline constraint shaping 2026-2030 blade design: NREL's thermoplastic-resin and thermal-welded joining programme is explicitly positioned to cut composite waste while enabling longer, lighter blades, and previous NREL work on thermoplastic systems underpins current automation work on blade finishing [S1]. Chronic carbon-fibre shortages continue to inflate input costs across the global supply chain, and analysts flag this as a structural headwind for the carbon-fibre-led 47.50% material share [S4].
Manufacturers that combine vertical integration with recyclable materials, advanced lightning protection, and remote monitoring are best positioned to compress lifetime maintenance spend, and the same modular, segmented 70 m+ format that addresses road-haul limits also reduces field-assembly failure risk on towers instrumented with PLC-based control loops [S4].
Comparable adjacent reference points
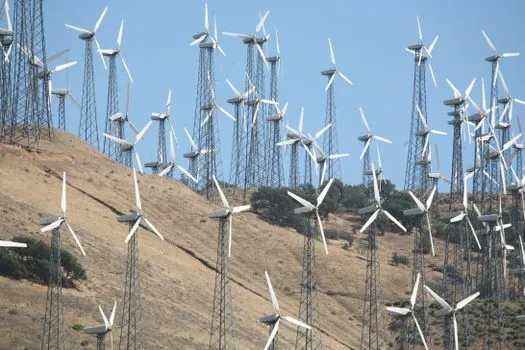
Two adjacent market structures are useful baselines. Grid-scale battery storage has consolidated faster than rotor blades, with a smaller top-three cohort controlling the majority of 2026 deployments, as mapped in this grid-scale battery storage snapshot. On the drivetrain side, the worm gear reducer selection guide for wind power auxiliary drives sets out the gearbox-side spec boundaries that any new blade or tower design has to match on yaw, pitch and pitch-bearing duty cycles. [S5]
Trackable signals for the next 90 days: GWEC's full-year 2025 supplier-by-supplier installation release, any update to the U.S. DOE blade manufacturing facility count beyond the 500-facility baseline [S2], and NREL CoMET outputs on thermoplastic-resin cycle times for above-75 m blades [S1].