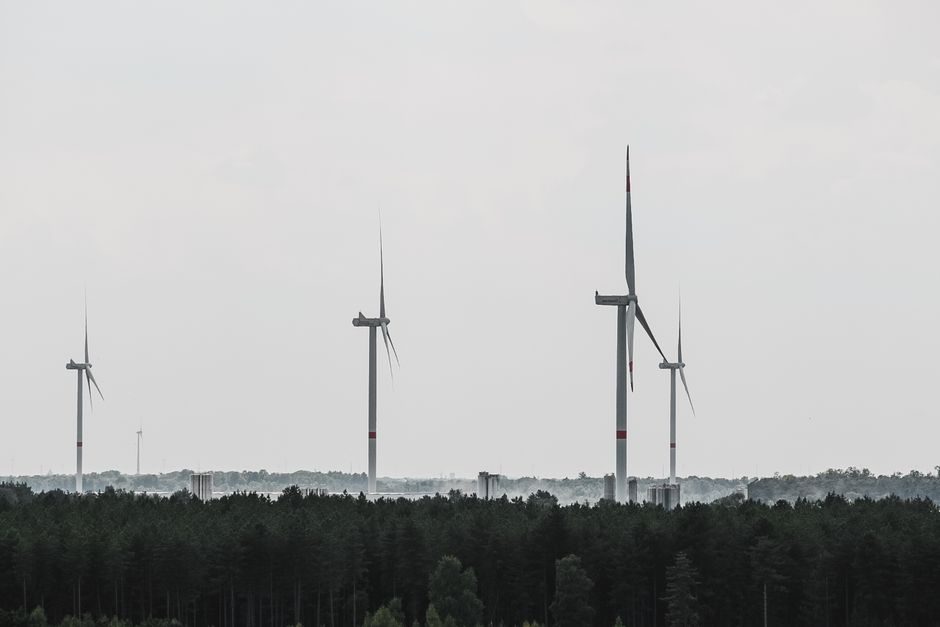
Wind-turbine blade manufacturing is a vertically layered chain: epoxy resin, carbon/glass fibre fabric, balsa/PVC core, gel-coat, and large structural castings on the input side, and asset owners, O&M contractors, drone inspection firms, and grid-scale storage integrators on the output side [S2][S4].
A modern utility-scale onshore 3 MW+ blade runs 40–80 m tip-to-tip with a rated aerodynamic tip speed of 80–90 m/s and a rated wind-speed envelope of 10–15 m/s, per the Simscape Driveline turbine reference model [S3]. A four-layer Deep Belief Network (two RBMs plus a classifier) has been shown to predict blade-icing faults from SCADA wind-speed and power features with higher accuracy and stability than an SVM baseline, anchoring the AI side of the condition-monitoring downstream segment [S1].
Upstream Layer: Composites, Core Materials, Sensors, and Hub Castings
Upstream of the blade mould, infusion-grade epoxy and vinylester resins, E-glass and heavier carbon-fibre fabrics, structural foam and balsa cores, plus UV-stable gel-coats form the bill of materials; the rotor hub, main shaft, and pitch-bearing housings come from large steel/ductile-iron foundries feeding the same nacelle assembly line [S4].
Blade instrumentation is sensor-heavy: strain gauges, fibre-Bragg gratings, accelerometers, surface temperature RTDs, and anemometers feed back to a nacelle PLC that closes the pitch and yaw loops; icing-risk SCADA inputs typically include ambient temperature, humidity, wind speed, and generator power residual [S1]. Hub hydraulic and pitch-system pressures are read by pressure transmitters specified for IEC 60079-classified zones on offshore units, while the rotor swept area A = πr² is the primary sizing parameter for any upstream aerodynamic tooling or dynamometer quote [S3].
Blade Manufacturing Itself: Where Upstream Meets the Mould
Blade OEMs convert the upstream feedstocks in vacuum-infusion or prepreg moulds; cured single-blade masses run 10–20 t for a 60 m+ offshore design, and epoxy/glass dominates by mass while carbon spar caps and root inserts take the cyclic flap-wise and edge-wise loads [S4].
Icing fault features engineered upstream — wind-speed residuals, power-curve error, generator torque swings — feed the DBN training set that the O&M tier consumes, closing the data loop between factory test bench and field SCADA [S1].
Downstream Layer: Owners, O&M Contractors, and Drone Inspection
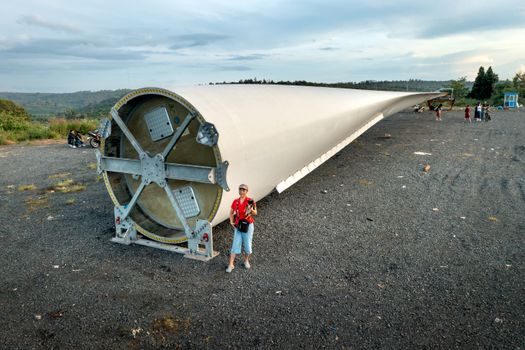
Downstream buyers of finished blades are utility-scale wind-farm owners, IPPs, and asset managers; downstream service providers include specialist blade-maintenance firms, rope-access and drone-inspection operators, and condition-monitoring software vendors [S2].
One North-America/Europe-focused specialist reports 100+ full-time blade technicians, 2,400+ turbines serviced, 152 wind farms supported, and 350,000+ hours on blades worldwide — figures that frame the addressable O&M labour pool, not the global market share [S2]. Their scope covers leading-edge erosion repair, structural assessments, interior blade work, and high-resolution drone inspections delivered with rope-access (SPRAT/IRATA) teams, with 16+ industry safety certifications carried per technician [S2].
Service Economics: Why Blade O&M Outweighs the Sticker Price
Downstream service revenue is dominated by the 20–25 year operating window, not the original blade sale; a single leading-edge erosion campaign on a 60 m blade is materially cheaper than a replacement, which is the lever specialist contractors sell to [S2].
Icing alone degrades aerodynamic performance and triggers unsafe shut-downs, which is why Deep Belief Network icing prediction was framed in the original IEEE work as a high-stakes generator-protection problem, not a yield-optimisation nice-to-have [S1]. Rated-power sizing for a 3–5 MW onshore unit is P_rated = 0.5 · ρ · A · V_rated³ · C_P,max with ρ ≈ 1.225 kg/m³ and V_rated in the 10–15 m/s band; the V³ sensitivity explains why blade-surface condition, ice accretion, and leading-edge roughness have a disproportionate O&M cost footprint [S3].
Failure Modes That Drive Both Upstream Specs and Downstream Spend
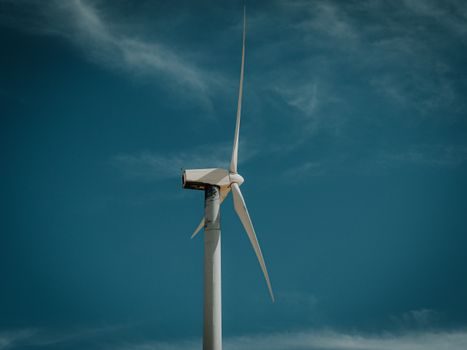
The five failure modes that consume both upstream material choices and downstream service hours are: leading-edge erosion, trailing-edge cracking, blade-root bolt fatigue, lightning-strike delamination, and ice-mass imbalance on the rotor [S1][S2].
Icing prediction uses wind speed, power, temperature, and humidity as input features to a DBN classifier, which then drives de-ice heater duty cycles and curtailment setpoints in the PLC; the same SCADA channel is the data source that downstream O&M dashboards visualise [S1]. Maintenance crews are dispatched from rope-access teams with SPRAT/IRATA certification, a workforce standard that the same service firm flags as a procurement gate for utility-scale tenders [S2].
Comparison: Upstream Feedstock vs Downstream Service on Four Buyer Criteria
On four buyer criteria, upstream composite feedstock and downstream O&M service sit at opposite ends of the supply chain: upstream competes on material certification, lead time, and per-kg price, while downstream competes on response time, certifications, and downtime cost per event [S2][S4].
Concretely: epoxy/glass fabric is graded on Tg (glass-transition temperature, typically 80–120 °C), tensile modulus, and infusion viscosity; structural foam core is graded on density (typical 60–200 kg/m³) and shear strength; hub castings are graded on NACE MR0175 sour-service compliance and Charpy impact at –40 °C for offshore [S4]. Downstream blade service is graded on technician hours per site (350,000+ cumulative hours is one operator's logged base), inspection throughput per shut-down window, drone resolution in mm/pixel, and the depth of the composite-repair scope (leading-edge, trailing-edge, interior) [S2].
Adjacent Downstream: Grid Integration, Storage, and Sourcing Risk
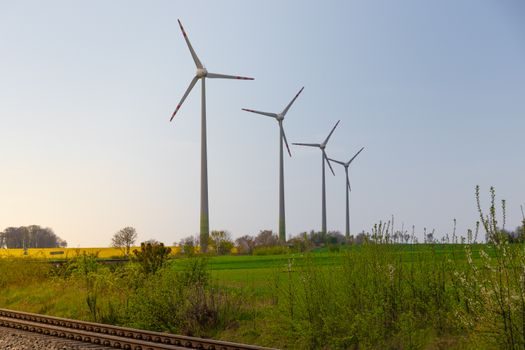
Beyond blade O&M, the downstream tier includes grid interconnection, flow meter and turbine flowmeter skids for cooling and HVAC balance-of-plant, and increasingly co-located battery storage to firm intermittent wind output [S3].
Grid-scale storage procurement has tightened in 2026 around cell-allocation lead times, containerised pressure sensor and fire-suppression specs, and tier comparison of system integrators — a parallel risk profile to blade supply, which informs how asset owners hedge their wind-plus-storage build pipeline. For gearbox and drivetrain sourcing the buyer-side spec map is now segmented by rated power, gearbox ratio band, and OEM service-network depth, with offshore units adding IEC 61400-1 design-class requirements on top of the drivetrain spec [S3].
Selection Criteria: What Each Side of the Chain Should Spec
Upstream procurement should lock Tg, modulus, void-content, and NDI coverage into the blade-mould purchase contract; downstream procurement should lock mean-time-to-respond, repair scope per shut-down, and drone-inpection data deliverables into the O&M master service agreement [S1][S2].
The DBN icing-prediction paper's choice of features — wind speed, generator power, temperature — is a usable template for any SCADA retrofit on legacy turbines that don't yet feed a condition-monitoring model, and the Simscape Driveline turbine block is a usable template for the controller-side simulation that pitches blades off-rated above V_rated = 10–15 m/s [S1][S3]. For industrial valve and pitch-hydraulic skids the same per-turbine pressure and flow instrumentation chain is duplicated at the hub and the nacelle, so the spec sheet has to carry the same Ex/EMC ratings on both ends [S3].
Trackable near-term signals: (1) further peer-reviewed work applying DBN or successor transformer architectures to icing prediction on operating wind farms, (2) consolidation moves among specialist blade O&M contractors as the 350,000-hour benchmark becomes a bidding threshold on multi-year MSA renewals, and (3) the maturing 2026 spec bands for co-located grid-scale battery storage and energy-storage system supply risk, which together will set the floor on what firmed-MW wind capacity looks like at the POI.