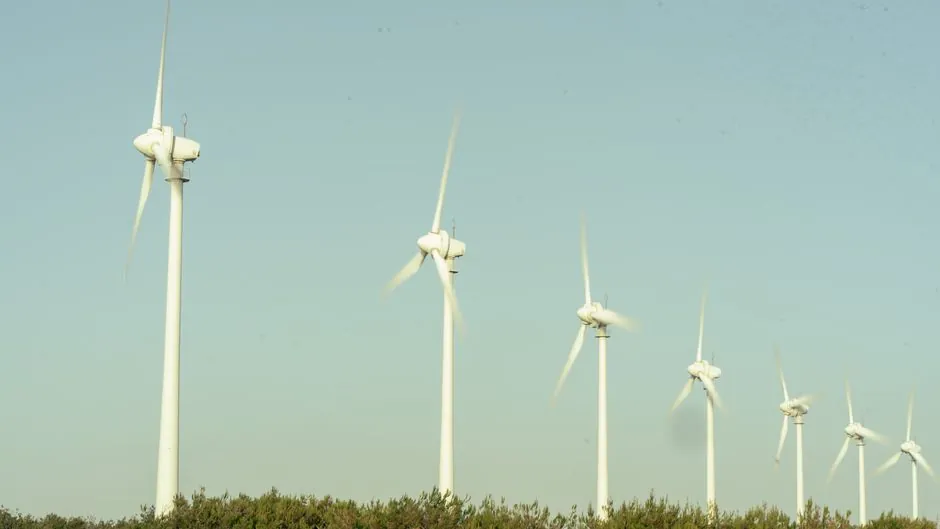
Global installed wind capacity reached 1,299 GW by the end of 2025 after a record 165 GW of new wind capacity was added in a single year, up 40% on the prior year, with 28,395 wind turbines installed across 57 countries [S2]. That fleet size is the binding variable for wind-turbine gearbox demand, because every new megawatt and every operating megawatt generates an attributable share of planetary and helical stage requirements, plus a downstream stream of replacement units once machines clear warranty.
Electricity demand is forecast to grow at an average 3.6% per year over 2026-2030, with emerging economies accounting for nearly 80% of additional consumption through 2030 [S1][S5]. Wind generation is set to grow at a strong pace inside that mix, and the IEA's regional breakdowns imply that the next 1,000 GW of wind build will be disproportionately concentrated in Asia, the same region that commissioned 131 GW, or 80% of the 2025 total [S2][S5].
2025 install baseline: where the gearbox order book actually starts
Two facts frame every 2026-2030 gearbox forecast. First, the 2025 add of 165 GW was not a one-off, it is the new floor: GWEC's report explicitly positions 2025 as "the clearest sign yet of the sector's rapid growth" rather than an outlier [S2]. Second, the geographic skew matters for drivetrain sizing, because China's 120 GW of new capacity skews toward direct-drive and semi-direct-drive platforms, while India's 6.3 GW, almost double the prior year, and the EU-27's 15.1 GW are more gearbox-heavy per-megawatt [S2].
Cross-reference against the encyclopedia entry on gearboxes shows the per-megawatt bill of materials does not scale linearly with nameplate, since 8-10 MW onshore and 14-18 MW offshore units use larger planet stages with higher torque density.
2026-2030 demand drivers: capacity additions, repowering, and the aftermarket pull
Three independent demand streams feed the gearbox order book. Stream one is new unit fitment, driven by GWEC's 2026 Global Wind Report pipeline. Stream two is repowering, which replaces aging 1.5-2.5 MW gearboxes with modern higher-ratio units. Stream three is the aftermarket replacement of planetary stages, bearings, and high-speed gear sets on the 1,299 GW operating fleet, with replacement cycles clustering at 7-10 years for first-stage planet bearings [S2].
Capacity additions in the 2026-2030 window are reinforced by US utility capex commitments, with RRA's 2026 capex forecast near $1.3 trillion over five years, roughly 29% above the $200 billion spent in 2025, much of which flows to wind interconnection and balance-of-plant that pair with turbine OEMs [S4]. WEC separately forecasts two data centers totaling 3.9 GW of demand over 2026-2030, a 45% jump from current peak demand, with a planned generation mix of 11% wind, 6% hydro, and 5% solar, putting incremental GW demand on a grid that still needs firming renewable build [S6].
Regional comparison: where the gearbox pull concentrates, and where it thins
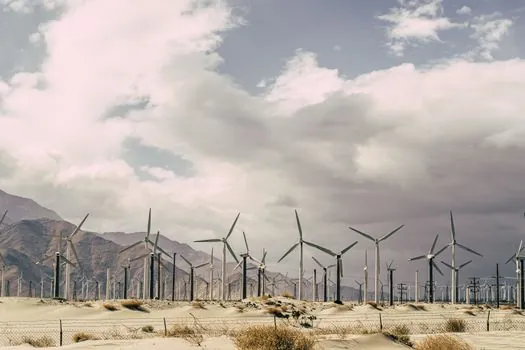
Different regional markets drive different gearbox architectures. China at 120 GW of 2025 additions remains the largest single market, and a meaningful share of that volume sits on permanent-magnet direct-drive and semi-direct-drive turbines that do not contain a multi-stage gearbox, which trims the Chinese demand curve for traditional planetary-helical units [S2]. Europe passed 300 GW of cumulative installed capacity, installed 19.1 GW in 2025 (up 16%), and the EU-27 specifically added 15.1 GW (up 17%), still below the annual average needed to meet 2030 climate targets, a gap that pulls additional gearbox demand into the late 2020s [S2].
India nearly doubled annual installations to 6.3 GW, and the country's renewable generation grew 20% in 2025, with wind up 28% [S2][S5]. US onshore wind installations rose by almost 7 GW, demonstrating continued strength, though US policy sensitivity around tax credit timing is a known swing factor not quantified in the public data [S2]. For a closer look at the upstream blade market that pairs with gearbox sizing, the 2026 blade manufacturer snapshot lays out the rotor diameter trends that drive torque-loading on the low-speed shaft, and the broader 2026-2030 blade build-out map tracks the regional cadence that drivetrain suppliers should size against.
Industry operating experience consistently places aftermarket and replacement service at a majority share of gearbox revenue over a turbine's 20-25 year design life, with the first major intervention typically occurring in years 7-10 on first-stage planet bearings and high-speed-stage gears. Applied to a 1,299 GW operating fleet, even a small fraction of machines entering the replacement window each year produces a steady multi-thousand-unit pull that is less cyclical than OE [S2].
US repowering economics are reinforced by the S&P 2026 utility capex forecast at roughly $1.3 trillion through 2030, with much of the spend directed at transmission and renewable interconnection that pair with repowered sites [S4]. ERCOT, by contrast, illustrates the constraint case: forecasts show reliance on intermittent generation continuing for at least the next few years, raising winter reliability questions that affect turbine dispatch but not the underlying gearbox wear pattern, which is governed by rotor rotations rather than grid curtailment [S7]. For drivetrain spec selection across adjacent heavy-duty applications, the mining gearbox 2026 spec map and the agricultural worm gear reducer spec map offer useful comparison points on planetary stage selection under shock load.
Sizing the 2026-2030 gearbox order book: a worked estimate, with caveats
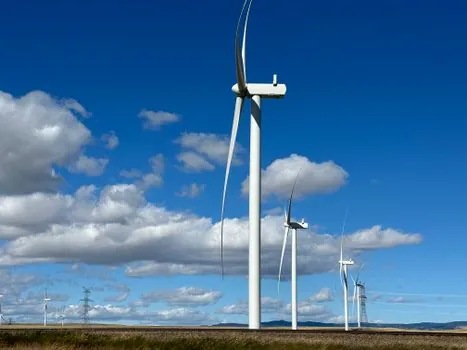
The lower end of the range is anchored by OE fitment only, the upper end includes first-cycle aftermarket replacement on machines that came online in the 2016-2019 cohort [S2].
GWEC's CEO framed 2025 as setting "a new benchmark for an industry which is rapidly accelerating," and explicitly warned that the world is "still not on track to triple renewables by 2030," citing slow grid rollout and permitting as the binding constraints [S2]. Those constraints cap the upside of the gearbox demand curve, but they do not change its direction: the gearbox spec map for wind applications in 2026 already points to higher torque density per stage, larger planet-carrier housings for 10+ MW onshore units, and condition-monitoring interfaces that feed into the same SCADA layer as the pressure transmitter and flow meter instrumentation that drivetrain test stands require.
Trackable signals for the next 12-18 months
Three signals will validate or stress-test this 2026-2030 gearbox demand curve. First, GWEC's 2027 Global Wind Report will disclose 2026 install volumes, the first data point on whether the 165 GW 2025 add was a plateau or a launch pad. Second, US PTC and ITC treasury guidance timelines, which sit behind the $1.3 trillion 2026-2030 utility capex baseline, will determine whether US onshore adds hold or slip [S4]. Third, China's 2026 direct-drive versus geared split in publicly reported OEM order books will determine whether global gearbox unit volume tracks nameplate GW or grows more slowly per MW, a distinction that matters for planetary stage forging capacity planning [S2].