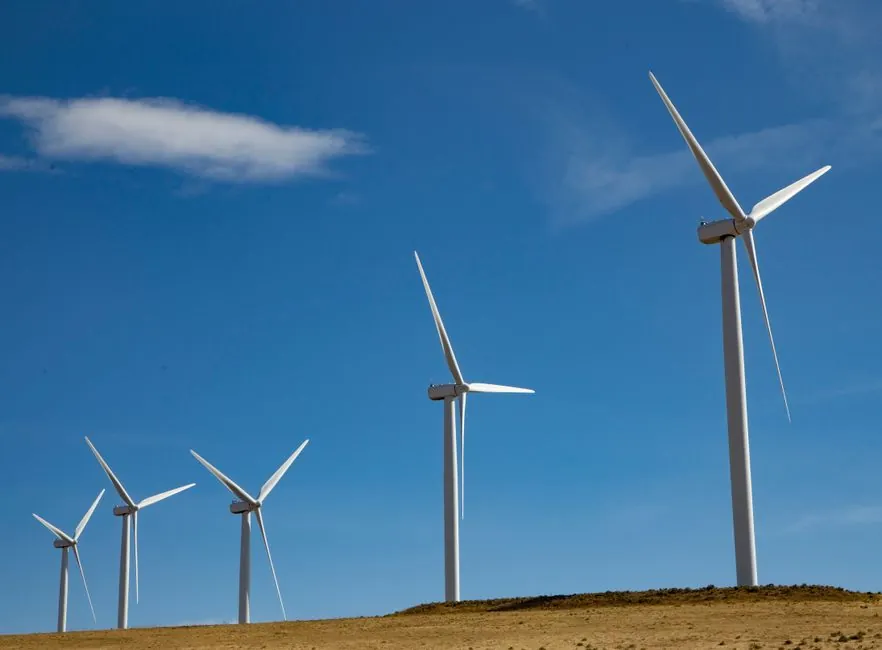
Global wind blade demand between 2026 and 2030 is anchored by three large regional build-out curves: the US market, which installed 8.2 GW in 2025 and is forecast to reach roughly 11 GW in 2026 on a path to about 48 GW of cumulative additions through 2030 [S1]; Europe, which added 19.1 GW in 2025 (17.2 GW onshore, 2.0 GW offshore) and is projecting a 2026 to 2030 ramp [S2]; and China, whose cumulative offshore wind capacity already passed 47 million kW and is targeted to exceed 100 million kW by 2030 [S3].
For procurement and process engineers, the headline is that blade tonnage, hub height, and rotor diameter are all moving in the same direction: bigger, longer, and increasingly produced under marine-grade coating and lightning-protection specifications. A single 15 MW offshore turbine now ships with blades in the 90 to 115 m range, and a typical US onshore project in 2025 averaged about 100 m hub height and 4.1 to 4.5 MW per turbine, which sets the input curve for blade and tower factory scheduling [S1][S3].
Regional blade demand: US 48 GW pipeline drives onshore, not offshore
The US pipeline through 2030 totals roughly 48 GW of new wind capacity, with 2025 installations at 8.2 GW (a 49% year-on-year jump) and 2026 expected at around 11 GW [S1]. This is overwhelmingly an onshore build: Wood Mackenzie's 2026 outlook is dominated by repowering and greenfield onshore sites in the Plains and Midwest, and the 48 GW figure does not imply a parallel offshore ramp in US blade demand. The 2025 turbine mix averaged 4.1 to 4.5 MW per unit, pushing blade mass and root-end diameters upward.
For blade procurement teams, the US signal is a stable, high-volume onshore pull rather than a step-change in blade length. The bigger question for US suppliers is whether the Inflation Reduction Act manufacturing credits continue to pull blade production back onshore; the article on US blade manufacturing and repowering trends covers that supply-chain side. Order lead times for US-made blades in 2025 stretched into 18 to 24 months for the largest 5 MW+ rotors.
European build: 19.1 GW in 2025, blade spec splits between onshore and offshore
Europe installed 19.1 GW of new wind capacity in 2025, with 17.2 GW onshore and 2.0 GW offshore, up from 16.4 GW in 2024 [S2]. The onshore share (90%) still dominates European blade demand, but the offshore segment is where blade length and material spec are moving fastest. Northern European offshore projects in 2025 to 2026 are predominantly 14 to 16 MW turbines with rotor diameters of 220 to 260 m, requiring blades over 100 m long with thicker laminates at the root and higher TPU or PVC core content.
The four leading installer countries in 2025 were Germany (5,232 MW onshore, 503 MW offshore), Turkey (2,142 MW onshore, 0 MW offshore), Sweden (1,767 MW onshore, 0 MW offshore), and Spain (further detail truncated in source) [S2]. Wind generation in the EU reached 465 TWh in 2025, covering 19% of electricity demand, the same share as 2024 but at a slightly lower absolute volume. That flat share masks a real year-on-year volume rise because electricity demand itself fell; for blade suppliers, the takeaway is that 2026 European order books are anchored by 14 to 18 GW of annual installation capacity with a tilt toward larger onshore rotors in Germany, the Nordics, and the Iberian Peninsula.
China deep-water offshore push: 100 million kW by 2030 reshapes blade material spec
China's cumulative offshore wind capacity passed 47 million kW at the end of February 2026, up 22.8% year-on-year for total wind capacity (650 million kW overall), and the National Energy Administration's target exceeds 100 million kW of cumulative offshore wind by 2030 [S3]. Two operating reference points matter for blade spec: the China Huaneng Group offshore farm in Shandong operates in 52 to 56 m water depth, about 70 km offshore, with 504,000 kW installed; the China Huadian project off Yangjiang, Guangdong, sits up to 89 km offshore and is the farthest-from-shore project under development in China.
By the convention cited in the source, projects in water deeper than 50 m are classified as deep-sea offshore wind, and projects more than 65 km from shore are far-offshore [S3]. Both classifications drive harder blade requirements: thicker gel-coat or anti-erosion leading-edge protection, higher fatigue ratings due to stronger and more stable but gustier winds, and stricter corrosion specifications on root bolts and lightning receptors. The manufacturer-share snapshot for wind turbine blades in 2026 maps who is supplying this Chinese offshore ramp; the dominant cluster is in Yancheng, Jiangsu, where total Chinese wind turbine production capacity is concentrated.
Spec comparison: onshore 4 to 5 MW blades vs offshore 14 to 16 MW blades
On a side-by-side spec basis, the two blade families that matter for 2026 to 2030 procurement are the US and European onshore 4 to 5 MW unit, and the European and Chinese offshore 14 to 16 MW unit. On rotor diameter, onshore sits at 160 to 200 m and offshore at 220 to 260 m. On blade length, onshore is typically 60 to 80 m and offshore 100 to 115 m. On root-end bolt circle, onshore uses M36 to M48 and offshore uses M48 to M64. On leading-edge protection, onshore is generally a single-coat polyurethane or tape system, while offshore needs thicker tape or metal-arc erosion shield due to higher tip speeds and rain/dust load. On weight, a single 4 to 5 MW onshore blade runs 18 to 30 t, while a 14 to 16 MW offshore blade is 50 to 70 t including root. [S3]
For OEM and tier-1 buyers, the offshore blade adds roughly 2x to 2.3x the per-unit composite consumption, with proportionally more carbon fibre or higher-modulus glass at the spar cap, and a step up in closed-cell foam or balsa core cost. Lead time for an offshore blade mold run is typically 24 to 36 months, against 12 to 18 months for onshore, which means 2026 to 2030 offshore capacity additions must be backed by mold investments made in 2023 to 2026.
Workforce, sensor, and process control constraints on the 2026 to 2030 ramp
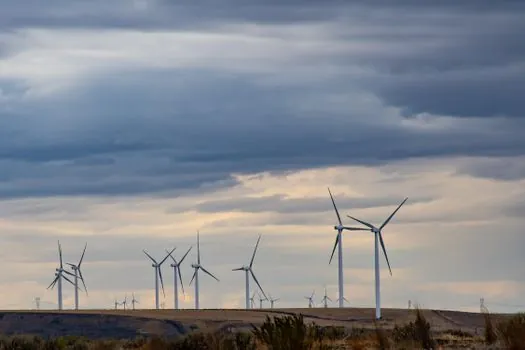
The US Bureau of Labor Statistics projects 60% employment growth for wind turbine technicians between 2023 and 2033, making it one of the fastest-growing US occupations [S4]. Globally, IRENA and ILO counted at least 16.6 million renewable energy jobs in 2024, with Solar PV the largest single sub-sector at 7.3 million jobs [S4]. The constraint is not demand but the supply of trained installers, blade service technicians, and quality engineers. A single 14 MW offshore blade change-out requires a crew of 12 to 20 working with a specialist uptower crane or jack-up vessel, and the global pool of rope-access blade technicians is still tight.
On the process side, this pulls demand for instrumentation in the manufacturing and O&M chain. Root-end torque verification and pitch-system hydraulic pressure monitoring depend on pressure transmitters rated for outdoor marine atmospheres, while nacelle vibration trending uses industrial accelerometers and vibration sensors with IEC 60079-class hazardous-area certification when placed in generator compartments. Blade factory molding lines rely on flow meters for resin injection and temperature control valves, and blade pitch and yaw systems use solenoid and proportional valves referenced against PLC controllers to hold tip angle within typical ±0.5° accuracy.
Risks and what to watch between 2026 and 2030
The most trackable downside signal for 2026 to 2030 blade demand is grid interconnection queue length, not turbine order books. The 48 GW US pipeline [S1] and the 100 million kW Chinese offshore target [S3] are both gated on transmission build-out: if interconnect timelines slip beyond 2027, blade factories running hot in 2026 could see cancellations the following year. The other signal is the offshore wind LCOE spread versus solar-plus-storage; in 2025 European offshore LCOE sat in the 60 to 90 EUR/MWh band against grid-scale solar at 40 to 55 EUR/MWh, so any further compression of the gap will pull blade volumes higher, and any widening will dampen the offshore curve while leaving onshore demand largely unaffected.
Watch the next quarterly Wood Mackenzie US install print (expected October 2026) and the National Energy Administration's monthly Chinese capacity releases. A 2026 US install number below 9 GW, or a Chinese offshore capacity print that stalls under 50 million kW cumulative by year-end 2026, would be the first hard data point that the 2026 to 2030 blade demand curve is bending below the published trajectory.