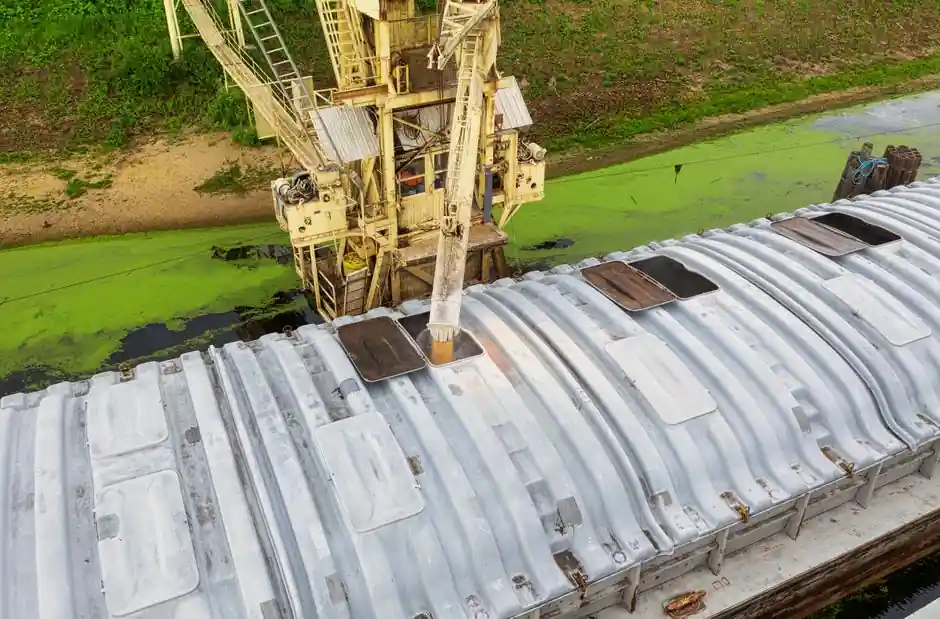
The standard greenfield capacity envelope for a zinc ingot manufacturing facility sits between 10,000 and 50,000 metric tonnes per year, with project reports sizing units inside that band to balance economies of scale against market segmentation [S1][S2].
Global consumption reached 12.27 million tonnes in 2025 and is forecast to climb to 15.63 million tonnes by 2034 at a 2.7% CAGR, against a 2024 world mine production base of 12.0 million tonnes, so any new capacity decision must be matched to a real regional concentrate and refining supply chain, not headline demand alone [S1][S2][S4].
Plant capacity band and what the 10,000-50,000 MT envelope actually delivers
Project reports for 2026 feasibility studies uniformly specify a 10,000-50,000 MT per year nameplate for a single new zinc ingot line, a range that covers regional merchant plants serving construction and galvanization while leaving room for higher-volume automotive and die-casting supply [S1][S2].
At that scale, gross profit margins of 15-25% and net margins of 5-12% are the cited financial envelope under normal operating conditions, supported by value-added specialty positioning and stable downstream demand [S1][S2]. The envelope is wide enough to let a builder right-size to a regional LME-zinc basis differential, power-tariff zone, and concentrate supply radius rather than force a one-size-fits-all mega-line [S3].
Process flow and unit operations a capacity plan must wrap around
The zinc ingot process is a fixed sequence: concentrate preparation, fluid-bed roasting, sulfuric acid leaching, impurity removal (iron, cadmium, cobalt, nickel), electrowinning, melting, and casting, with germanium and indium recovered as by-products at the refinery stage [S5][S7].
Smelting furnaces, refining equipment, and casting machines are the three capital lines that scale linearly with the 10,000-50,000 MT target, and utility demand (roaster off-gas treatment, sulfuric acid plant, electrolytic cellhouse rectifiers) sets the real floor on capex regardless of how the nameplate tonnage splits [S3]. Operators running residue or secondary feed instead of clean concentrate will see leaching parameters drift, which is why data-mining optimization of pulp and acid operations has been used to recover yield when feed quality falls [S5]. For plant instrumentation, the acid-leach circuit, cellhouse, and casting bay are where pressure transmitters, flow meters, and industrial valves are specified in the densest clusters, and where sloppy sensor choice can wipe out the 2.7% CAGR economics on its own.
Demand mix driving the capacity decision: galvanizing, alloys, die-casting
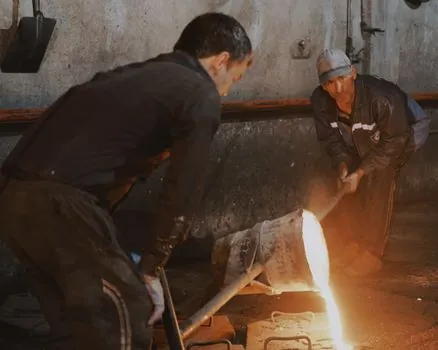
Galvanizing absorbs 60% of global zinc use, zinc alloy production 15%, zinc compounds 11%, brass and bronze 9%, and semi-manufactured products 4%, with the residual 1% spread across miscellaneous chemical and rubber uses [S4].
That mix is why a new 10,000-50,000 MT/yr line cannot be planned in isolation from the regional galvanizing and brass mill customer base: a plant sited near automotive sheet galvanizers or brass fittings producers will see steadier off-take than one chasing only the open-market LME price, where treatment charges (TCs) and concentrate availability dominate realized margin [S3][S4]. For the casting bay downstream of the cellhouse, zinc die casting machine selection is the natural next decision once ingot capacity is fixed, and a poorly matched die-cast cell will strand a portion of nameplate output as off-spec alloy.
Concentrate supply, geopolitics, and the real ceiling on nameplate
Canada's mined zinc output fell from 305,314 tonnes in 2017 to a decade low of 109,507 tonnes in 2023 before rebounding to 129,202 tonnes in 2024, while refined zinc production declined to roughly 521,000 tonnes in 2024, evidence that even a mature producer can swing concentrate supply against refinery utilization [S4].
Geopolitical factors in China, Australia, and Peru directly move concentrate availability, and any 10,000-50,000 MT/yr capacity plan that assumes frictionless imported concentrate will underperform its 15-25% gross margin envelope the first time a major smelter region tightens export licensing [S3]. The CSIS assessment that U.S. Red Dog output is forecast to drop 7% in 2025 with the mine projected to close in 2031 is a concrete signal that a regional 10,000-50,000 MT/yr plan cannot ignore the concentrate cliff date when siting a new refinery or merchant cast line [S6]. For broader plant control architecture, the PLC layer for roaster, cellhouse, and casting interlocks is the other spec decision that must lock alongside the concentrate contract, not after it.
Comparison: capacity options lined up against decision criteria
Three capacity brackets dominate the 2026 feasibility landscape, and each trades off differently against the criteria that drive a real go/no-go. [S1]
First, a 10,000 MT/yr single-line merchant plant: lowest capex per project report band, fastest payback in regional galvanized-steel niches, but exposed to TC volatility and limited ability to anchor a long-term offtake [S1][S2]. Second, the 25,000-30,000 MT/yr mid-band: the most common 2026 spec, balances automotive and brass offtake with concentrate draw, supports a 15-25% gross margin envelope under normal operations [S1][S2]. Third, a 50,000 MT/yr upper-band line: best unit economics on capex per tonne, but concentrates procurement and sulfuric acid offtake become binding constraints, and any 7% drop in a key feed source like Red Dog will push utilization below the breakeven of the smaller bands [S1][S2][S6]. Across all three, the pressure sensor count on the leach and cellhouse circuits scales with nameplate, and that instrument load is a hidden capex line that a DPR at the top of the band must not under-budget.
What capacity planning is NOT for, and where the 2026 plan fails
A 10,000-50,000 MT/yr greenfield is the wrong answer for a buyer who only needs a regional casting satellite, where toll-converting or ingot procurement from Glencore, Teck Resources, Hindustan Zinc, Nexa Resources, or Votorantim Metais is faster and cheaper than building [S3].
It is also the wrong answer for a plan that treats concentrate supply as solved; the same DPRs that headline the 2.7% CAGR also note that geopolitical disruption in China, Australia, or Peru can invert the supply curve inside a single fiscal year [S3]. For a project that needs to be operational before the Red Dog 2031 closure window, the binding constraints are not the 10,000-50,000 MT capacity band itself but the sulfuric acid plant, the cellhouse rectifier fleet, the casting machine line, and the roaster off-gas treatment train, all of which carry multi-year lead times that a 2026 capacity decision must trigger immediately [S6][S7]. For related planning context on how a casting cell dovetails with upstream material choice, the spec-first material selection map for energy and process equipment is a useful parallel read on how downstream specs lock the upstream envelope.
Trackable signals for a 2026 capacity decision
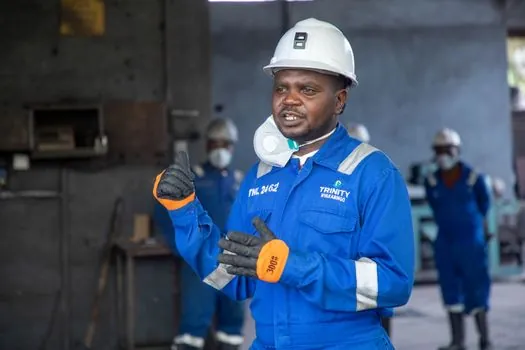
Two nodes are worth watching through 2026 Q4: the realized LME zinc treatment charge trend, which moves inversely to concentrate availability and is the single best leading indicator of whether a 10,000-50,000 MT/yr line will hit its 15-25% gross margin envelope [S1][S2], and any 2026 update on the Red Dog 2031 closure timeline, since that mine alone is forecast to drop 7% in 2025 and reshapes North American concentrate supply economics for every greenfield plan sited in that draw radius [S6]. A third useful signal is the next IMARC or equivalent annual update to the 15.63 MT/yr 2034 demand figure, which will confirm whether the 2.7% CAGR holds or compresses as galvanizing and brass offtake track construction cycles [S1][S2].