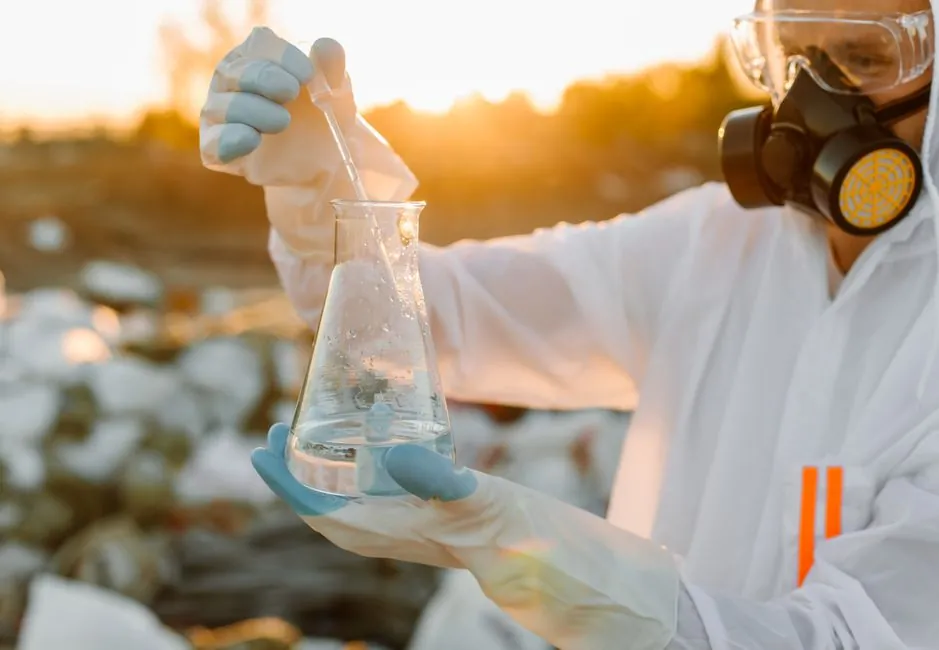
US delivered activated carbon prices climbed to USD 949.69/MT CIF in July 2026 from USD 770.86/MT in June, a 23.2% month-on-month jump, while China's FOB price stayed flat near USD 762.69/MT [S4]. The disconnect came from water treatment demand, particularly PFAS removal projects, which held Western CIF costs firm even as Asian supply loosened [S4].
The US market volume is forecast to expand from 216.24 kilotons in 2025 to 223.64 kilotons in 2026 and 270.52 kilotons by 2031, a 3.88% CAGR anchored by the April 2024 NPDWR rule that forces roughly 6,000-8,000 community water systems to install granular activated carbon beds by 2029 [S5]. Globally, the activated carbon market is valued at USD 7.71B in 2026 and projected to reach USD 12.97B by 2032 at 9% CAGR [S8], with Fact.MR tracking a parallel USD 3.9B-to-USD 6.6B trajectory through 2036 at 5.4% CAGR [S1].
Regional Price Spread: China FOB vs US CIF
July 2026 delivered prices diverged sharply by region: China FOB USD 762.69/MT, India CIF USD 869.69/MT, Germany CIF USD 896.69/MT, USA CIF USD 949.69/MT, Canada CIF USD 959.69/MT [S4]. The roughly USD 187/MT gap between China FOB and US CIF in July reflects container freight, NSFCertified reactivation capacity, and the regulatory premium utilities pay for NSF/ANSI 61-listed domestic supply [S5]. Indian CIF costs tracked between Chinese and US levels as import dependence and freight added roughly 14% over Chinese FOB [S4].
Asian supply conditions softened through Q2 2026: coconut-shell feedstock availability stabilized after earlier tightness, easing processor cost pressure, while high raw-material inventories and weak stockbuilding kept Chinese water-treatment and waste-gas buyers cautious [S4]. Coal-based grades received some cost support from environmental inspections and mine-safety measures that raised upstream coal expenses in China, partially offsetting the demand softness [S4]. For buyers tracking adjacent water-treatment infrastructure, the Air-Cooled Chiller Lead Times in 2026 article covers the same capital-procurement environment.
PFAS Removal: Why GAC Costs More Than Spot Carbon
PFAS adsorption on granular activated carbon operates through hydrophobic interaction (long-chain fluorinated tails bond via Van der Waals forces) and electrostatic interaction (anionic head groups bind to positively charged carbon sites at pH 6.5-8.5) [S3]. Removal efficiency scales with chain length: long-chain PFOA, PFOS, PFNA, PFDA (C7+) achieve greater than 95% removal; medium-chain PFHxS, PFHxA, PFHpA (C5-C7) reach 80-95%; short-chain PFBA, PFBS, GenX (C4 or fewer) achieve only 60-85% with much shorter bed life [S3].
Carbon with a well-developed mesopore network, typically coal-based GAC, outperforms highly microporous coconut-shell GAC for broad PFAS removal because PFAS molecules (0.8-1.5 nm molecular width) adsorb in mesopores (2-50 nm) and large micropores (1-2 nm) rather than the small micropores (less than 2 nm) that trap chloroform or TCE [S3]. The US EPA's 4-parts-per-trillion MCL for PFOA and PFOS is the single largest demand accelerator, contributing an estimated +1.2% to US activated carbon CAGR through 2029 [S5].
Cost Drivers: What Moves the 2026 Price
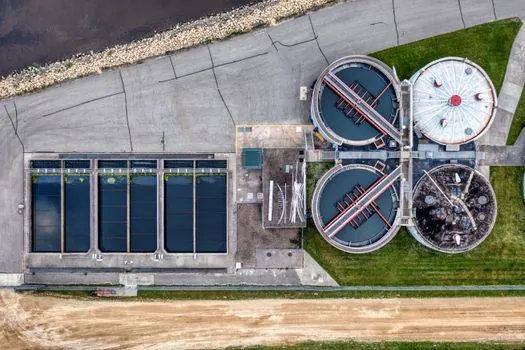
Five variables dominate the 2026 cost stack. First, feedstock: coal-based grades hold 45% of global volume and benefited from mine-safety-driven cost support in China; coconut shell prices eased after supply normalized [S1][S4]. Second, freight: transpacific container rates widened the China-US gap to USD 187/MT in July [S4]. Third, certification: NSF/ANSI 61 listing and domestic regeneration capacity command a regulatory premium for utilities chasing PFAS compliance [S5].
Fourth, replacement frequency: PFAS-scope GAC changeouts run 1-2 times per year depending on influent levels, with annual carbon replacement cost for a mid-sized utility typically USD 60,000-USD 120,000/yr on top of capex [S3]. Fifth, application mix: water and wastewater treatment captures 38% of global volume, liquid-phase applications account for 68%, and municipal water utilities contribute 30% of end-user demand [S1]. Power sector coal imports, which surged to a 15-month high in August 2026 on heat-driven Indian demand, also tightened thermal coal supply and rippled into activated carbon feedstock pricing [S4].
Grade Comparison: Coal vs Coconut vs Powdered
Three options line up against common decision criteria. Coal-based GAC: 45% of global volume, best mesopore network for PFAS, mid-range cost, dominant in municipal water treatment [S1][S3]. Coconut-shell GAC: highly microporous, harder and denser, excellent for trace organic removal but weaker on short-chain PFAS, typically 15-25% above coal-based pricing on a USD/MT basis due to climate-driven supply variability [S3][S5].
Powdered activated carbon (PAC): holds 44% of global volume by form factor because rapid adsorption kinetics suit water-treatment and industrial purification dose-feed systems, but PAC is rarely specified for PFAS contactor duty where bed life and hydraulic handling favor GAC [S1]. Extruded or pelletized grades are forecast to grow at 4.34% CAGR through 2031, concentrating in gas-phase and supercapacitor applications rather than bulk water treatment [S5].
Total Cost of Ownership: Beyond the USD/MT Sticker

Purchase price is the smallest line on a multi-year PFAS project. A typical GAC PFAS installation carries annual carbon replacement of USD 60,000-USD 120,000/yr depending on influent PFAS concentration and bed changeout frequency (1-2 per year), plus PFAS monitoring at regulated reporting frequencies, plus capital amortization on the contactor system [S3]. For a mid-sized utility serving 50,000-100,000 people, the annualized all-in cost commonly lands 2-3x the spot carbon line item once monitoring, labor, regeneration logistics, and spent-carbon disposal are included.
Cooperative purchasing agreements have emerged as a cost lever: smaller utilities that would otherwise struggle to absorb the per-ton premium for NSF/ANSI 61-certified domestic supply now pool demand through state and regional buying groups, with matching grants in Michigan and New York shortening payback periods [S5]. This pooling approach mirrors procurement patterns used in other industrial capital buys covered in the Case Packer Installation and Commissioning Checklist, where multi-vendor scope drives standardized specification across sites.
Standards and Sourcing Discipline
Three certification and regulatory anchors govern the 2026 spec. The April 2024 US EPA National Primary Drinking Water Regulation sets the 4 ppt MCL for PFOA and PFOS that drives GAC procurement across community water systems [S3][S5]. NSF/ANSI 61 listing is the practical gateway for any carbon contacting potable water; vendors without it are excluded from PFAS-driven municipal bids [S5]. The April 2024 NPDWR enforcement clock, with a 2029 compliance horizon, is the demand-pull mechanism that lifted the EPA PFAS/PFOA driver to +1.2% impact on US CAGR [S5].
For industrial buyers, the Revised Mercury and Air Toxics Standards (MATS) push coal-fired utility operators toward powdered injection systems, adding an estimated +0.8% to US CAGR on a short-term (under 2 years) timeline [S5]. Pharmaceutical API expansion, clustered in New Jersey, North Carolina Research Triangle, and Puerto Rico, adds +0.7% on a long-term (4+ years) horizon, and is the only major demand source not directly tied to environmental compliance [S5]. Buyers weighing carbon grade against the broader spec stack can cross-reference the engineering-decision logic in ASME B30.5 Mobile Crane Requirements, which uses a similar drivers-and-timeline approach to project specification.
Forecast Signals and Trackable Nodes

Two nodes are worth watching through Q4 2026. First, the September Procurement Resource price update for Q3 2026 will reveal whether the July US CIF jump to USD 949.69/MT holds, retreats toward the June USD 770.86/MT level, or extends further as PFAS contract awards ramp into the 2029 deadline [S4]. Second, US utility PFAS contract awards through the EPA's Emerging Contaminants funding window and state revolving loans will move volume from spot-buyers to long-term framework agreements, which historically tighten spot availability for non-framework buyers [S5].
The US volume forecast of 223.64 kilotons in 2026 against 270.52 kilotons by 2031 implies roughly 47 kilotons of incremental annual demand to fill, most of it GAC destined for PFAS contactors, and the Mordor Intelligence data point that 58.42% of 2025 US volume already went to water purification suggests the 2026-2031 incremental tonnage is even more PFAS-weighted than the headline mix [S5]. For engineering spec work, the practical implication is straightforward: budget for coal-based GAC at the higher end of recent delivery ranges, plan for 1-2 bed changeouts per year, and write NSF/ANSI 61 and 4 ppt PFOA/PFOS compliance into the bid package before pricing is solicited.
Spec-level background on the components involved: carbon fiber, carbon steel, and ballast water treatment.