
Black mass payables have become the single largest swing factor in lithium-ion battery recycling economics, with feedstock costs reaching up to 70% of total production cost on hydrometallurgical upcycling routes that combine black mass with make-up metal sulfates [S7].
Material flow tension is structural, not cyclical: the global black mass recycling market is projected at USD 16.42B in 2026, expanding to USD 39.04B by 2031 at 18.91% CAGR, while a parallel China-only market is valued at USD 7,092.3M in 2024 with a 9.3% CAGR toward USD 22,728.8M by 2029 [S4][S5]. Asia-Pacific alone held 48.89% of 2025 market share and is the fastest-growing region at 22.25% CAGR through 2031 [S5].
Payable Formulas, Metal Mix, and What Drives the Bid
Black mass is the shredded, separated product of end-of-life or manufacturing-scrap lithium-ion cells, rich in lithium, nickel, cobalt, manganese, and graphite, and serves as the essential feedstock for downstream refining into battery-grade sulfates and precursors [S3]. Payables in the spot market reference published metal prices (typically cobalt, nickel, lithium, and copper), apply agreed discount rates, and adjust for moisture, fines, and deleterious elements such as copper, aluminum, iron, and plastics that depress furnace yield.
Advanced elemental analysis of black mass is transforming lithium-ion battery recycling by tightening assay tolerance; XRF, ICP-OES, and ICP-MS protocols directly govern the discount schedule because recyclers hedge metal exposure between intake and refining [S8]. The lithium-bearing fraction dominated 57.73% of 2025 market share by material, with manganese recovery projected to grow fastest at 19.89% CAGR as cathode producers migrate toward manganese-rich chemistries [S5]. Process engineers evaluating this shift can cross-reference the broader mass-spectrometer toolchain used for trace-level metal verification in feed and refined product.
Capacity Build-Out vs. Feedstock Supply: A Two-Year Lag
Rising capacity to produce black mass in the US has created a very competitive market for scrap over the past two years, with multiple gigafactory-aligned recyclers chasing a feedstock pool that is still maturing [S1]. Cell production capacity globally exceeded 2,200 GWh in 2025, with an additional 800 GWh slated for completion before 2028, yet the corresponding end-of-life volume lags by roughly 8 to 12 years because today's dominant stream is gigafactory production scrap, not retired packs [S5].
The supply chain responds through vertical integration: Redwood Materials co-locates with Panasonic and Tesla in Nevada and channels scrap back to cathode precursor lines within 48 hours, while in Hunan Province, CATL and Brunp route production scrap directly into their own precursor supply chains, eliminating the bidding war at the gate [S5]. Capital intensity remains a constraint, with Ascend Elements-style hydromet builds priced in the hundreds of millions per site, and payables contracts increasingly structured to lock multi-year offtake against a floor and ceiling price band rather than monthly spot exposure.
Technology Routes: Hydromet vs. Pyromet vs. Direct Recycling
Hydrometallurgy captured 43.35% of 2025 market share by technology and remains the default route when black mass payables track sulfate-soluble metals such as nickel, cobalt, and manganese [S5]. Bio-leaching is the fastest-growing technology segment, projected at 21.25% CAGR through 2031, appealing to operators seeking lower acid consumption and milder wastewater profiles [S5]. Pyrometallurgical smelters treat black mass as a cobalt and nickel concentrate but lose lithium to slag, which penalizes them when lithium carbonate prices rise above typical thresholds.
For a process engineer, the cost comparison is direct: a hydromet route paying premium for low-copper, low-iron black mass with assays above 20% combined nickel-plus-cobalt will outperform a pyromet route on the same feed unless the smelter offers a significant processing fee concession. Filtration and wash-water recycling loops for hydromet plants are typically metered with thermal-mass-flowmeter instruments on acid and leachate streams, where repeatability below 1% of reading directly affects mass-balance closure and payable audit outcomes.
Policy Levers Reshaping the Bid Stack
Three policy mechanisms now distort the relative bid stack between domestic recyclers, brokers, and export buyers. The US Inflation Reduction Act clean-material tax credits add an estimated +3.5% impact to CAGR forecasts, while European Union and Chinese EV-OEM take-back mandates contribute +3.8% [S5]. Restricting exports of critical-mineral scrap in major economies (the EU, US, and China) effectively closes the arbitrage window that previously allowed domestic recyclers to be outbid by Asian hydromet operators paying in yuan-denominated contracts.
EV batteries led the source mix at 58.23% of 2025 black mass recycling market share, growing at 20.45% CAGR through 2031, while lithium-ion batteries overall held 49.35% share by battery type, and solid-state batteries are projected as the fastest battery-type segment at 20.23% CAGR [S5]. According to Mordor Intelligence, the global black mass recycling market is projected to grow from USD 13.81 billion in 2025 to USD 16.42 billion in 2026, with the expansion reflecting structural policy shifts that require domestic recovery of lithium, cobalt, nickel, and manganese, alongside an 18.91% CAGR forecast over 2026-2031 [S5].
Recyclers Hedging on Manganese-Rich Chemistries
Manganese recovery is slated to rise at 19.89% CAGR and overtake nickel as cathode producers migrate toward manganese-rich chemistries, a shift that changes which payables contracts hold value [S5]. A recycler locked into a 2024 nickel-heavy payable schedule will see revenue mix compress as LFP-to-NMC chemistry switches rebalance the metal basket, contributing an estimated +2.1% impact to CAGR forecasts on a global basis [S5].
Municipal e-waste partnerships unlocking urban feedstock contribute +1.6% to CAGR forecasts and represent a diversifying supply pool beyond automotive scrap; for facilities that co-process consumer cells with EV modules, this requires careful sorting to keep lithium iron phosphate streams from contaminating nickel-cobalt manganese feeds and triggering quality-assay penalties [S5]. Material handling in such mixed-feed plants typically depends on construction-machinery-and-equipment such as telehandlers, forklifts, and container handlers rated for hazardous-area zones, a topic detailed in this forklift component layout reference.
Selection Criteria: Who Wins the Feedstock Bid
Four selection criteria now separate winners from losers in the feedstock competition. First, assay transparency: recyclers offering in-house XRF plus ICP verification, with certificates traceable to batch-level sampling, command a tighter discount band. Second, offtake optionality: bidders offering take-or-pay volume commitments against IRA or EU Battery Regulation compliance credits win over spot buyers. Third, metal-mix flexibility: facilities engineered to switch between LFP, NMC, and manganese-rich feed without retooling capture the 19.89% manganese CAGR [S5]. Fourth, location: co-location with gigafactories or in industrial-zoned brownfield sites within 48-hour logistics radius of cell makers minimizes freight deductions in the payable formula [S5].
Smaller specialists, including the US-focused entrant American Battery Technology Company, are positioning as specialized battery recyclers and battery materials companies that can secure consistent feedstock through direct relationships with cell makers and OEMs [S2]. For independent recyclers, the alternative is a lamps-and-light-fittings and lighting-equipment-and-electric-lamps scrap-merchant model, aggregating smaller volumes from regional collectors and municipal e-waste programs, where margin is lower but feedstock acquisition cost is also lower.
Failure Modes and Constraints on the Payable Side
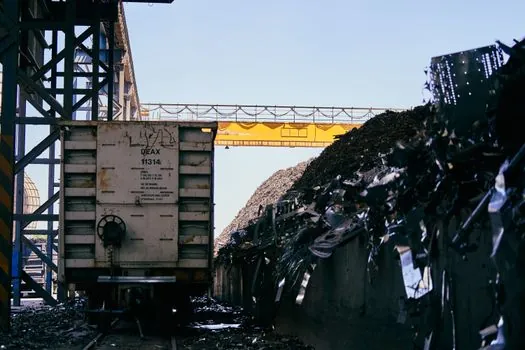
Three failure modes drive disputes in black mass payable contracts. Fines generation during transport and handling reduces the recoverable fraction, with over-sized particles failing furnace screen criteria. Copper contamination above 1 to 2% poisons hydromet solvent-extraction trains and can shut down a campaign. [S4]
Trackable Signals Through 2027
Three signals will indicate whether feedstock competition normalizes or tightens. First, the spread between benchmark nickel and cobalt payables and the underlying LME reference: a widening spread (recycler discount above 20%) signals feedstock scarcity; a narrowing spread (discount below 10%) signals competitive saturation. Second, the IRA Section 45X credit monetization rate: faster cash conversion improves bid capacity. Third, the LFP-to-NMC mix shift in new cell production, which will determine whether 2027 supply skews toward low-payable LFP black mass or higher-payable NMC black mass, and the 22.25% Asia-Pacific regional CAGR will be the leading indicator [S5].