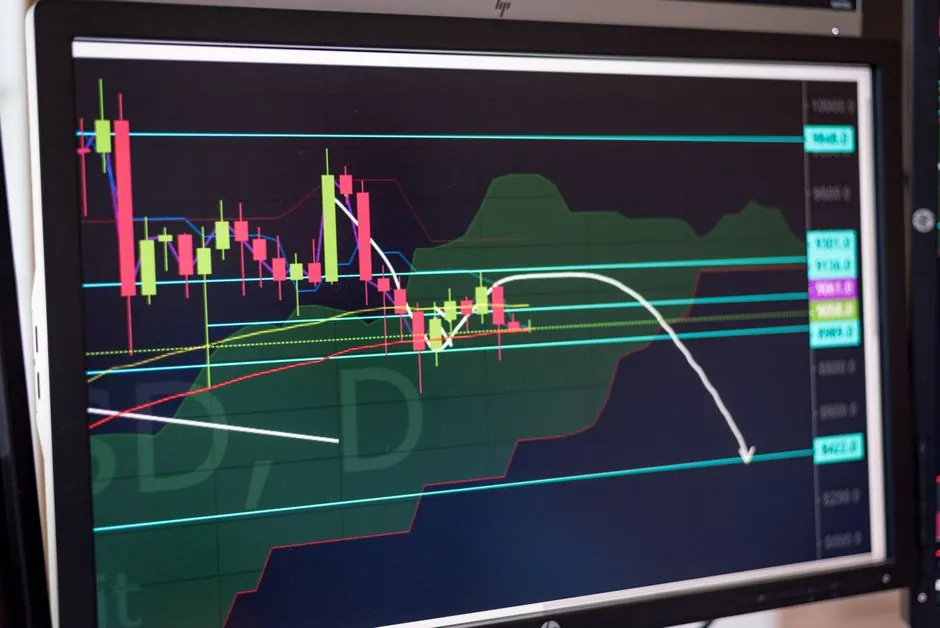
Germanium metal retailed at $9,866.05 per kg on October 9, 2026, a 69.70% gain year-to-date and a 139.42% rise since the start of 2025, with S&P Global's August 2026 report flagging an expected 177 t supply shortfall in germanium metal for the year [S2][S6].
Underlying the rally is a market where China still controls the dominant share of refined output, export licensing has constrained shipments since late 2024, and downstream demand from fibre optics, infrared optics, and satellite solar cells keeps pulling material into structural deficit [S3][S8].
Price trajectory: from $1,187/kg in 2021 to $9,866/kg in October 2026
The U.S. Geological Survey's Mineral Commodity Summaries 2026 shows germanium metal rising from an annual average of $1,187 per kg in 2021 to $1,991 per kg in 2024 and $4,100 per kg in 2025, a roughly 3.5x move in four years that the agency ties to supply concentration and rising import costs [S1]. Germanium dioxide tracked the same pattern, moving from $770 per kg in 2021 to $1,281 in 2024 and $2,500 per kg in 2025 [S1].
Spot benchmarks in 2026 accelerated further. The October 7, 2026 retail price of $9,939.26 per kg reflects 41.09% growth in 2025 and 69.97% in 2026 on the Strategic Metals Invest series, with the series recording a 250.98% rise over three years and 533.71% over ten years [S2]. Procurement Resource's regional August 2026 assessments show in-warehouse U.S. germanium at $6,348.58 per kg and in-warehouse German material at $6,361.30 per kg, while FOB China sat near $3,518 per kg in the same month [S4].
Supply cuts: China's licensing regime and a 177 t ex-China gap
S&P Global's Critical Mineral Market Report dated August 5, 2026 sizes current secondary germanium metal supply at approximately 39 t and projects a supply gap near 177 t Ge metal in 2026 from sources outside China [S6]. The IEA's Global Critical Minerals Outlook 2026 corroborates the broader backdrop, noting that critical mineral prices rebounded in 2025 and early 2026 driven by tight supply conditions across base and minor metals [S9].
China's export licensing system remains the principal near-term throttle. Procurement Resource documents that Chinese germanium exports "fell to almost negligible levels in April" 2026 before a partial May recovery, with most of the recovered volume shipped to Russia, and that Q2 2026 saw reduced domestic producer operating rates during April and May, tighter concentrate availability, and additional export-control measures raising procurement risk for foreign buyers [S4]. On the importer side, USGS reports U.S. imports of germanium metal fell from 21,000 kg in 2024 to an estimated 7,000 kg in 2025, a 67% year-over-year collapse that physical buyers and power supply fabricators sourcing germanium-bearing optoelectronics read as a near-term availability shock [S1].
Where germanium goes: fibre optics, infrared, space solar, defence
Market Data Forecast's August 2026 industry assessment places fibre optics as the largest end-use at roughly 35% of global germanium consumption, followed by infrared optics at 30% and electronics at 15%, with the high-purity segment projected to grow at 8.7% CAGR and fibre optics at 8.9% CAGR through 2034 [S5]. The same source notes that over 90% of satellites incorporate germanium-based multi-junction solar cells, a fact directly relevant to the industrial UPS and DC power supply supply chains that feed ground support and satellite manufacturing programmes [S5].
Strategic Metals Invest's industrial overview highlights the same five drivers: GeO₂ in fibre-optic glass cores, germanium's infrared transparency for night-vision and thermal cameras, pure-metal use in transistors and high-speed ICs, wafer substrates for space solar cells, and GeO₂ as a PET polymerisation catalyst [S2]. The pattern of end-use is consistent across S3, S4, and S8, and is the reason that demand does not fall away even at multi-year price highs: there is no widely deployed drop-in substitute for germanium in long-haul fibre core doping or in 8–14 µm thermal imaging optics [S3][S8].
Where the material comes from: zinc by-product economics and US import concentration
USGS documents that germanium is recovered almost exclusively as a by-product of zinc-ore processing, with a mine in Tennessee that previously produced germanium-bearing zinc concentrates suspended since November 2023, and a separate Alaskan operation whose concentrates are exported to a Canadian refinery for dioxide and tetrachloride recovery [S1]. U.S. net import reliance for germanium has been above 50% of estimated consumption every year from 2021 through 2025, and the 2021–24 import-source mix for germanium metal was China 41%, Belgium 27%, Germany 25%, Russia 3%, other 4%, with germanium dioxide dominated by Belgium 57% and Canada 37% [S1].
SFA Oxford's market note reinforces the structural side: germanium is not mined as a primary commodity, almost all primary supply is zinc smelter by-product, and secondary recovery from optical fibre manufacturing waste, decommissioned IR optics, and end-of-life solar cells adds tonnage but cannot on its own close the 177 t gap S&P Global identifies for 2026 [S6][S8]. The supply curve is therefore fixed by zinc-mining economics, not by germanium demand, which is why price rather than volume adjusts to clear the market.
Regional price comparison: Q2 2026 movements across FOB, CIF, and ex-warehouse bases
Q2 2026 was the clearest demonstration of regional dislocation. Global Risk Community's Q2 2026 report records that import prices for 99.99% purity germanium on a CIF Hamburg basis rose about 30.60% versus Q1 2026, while 99.99% FOB Shanghai export prices rose about 11.23% over the same comparison, a gap that captures the freight, licence, and inventory premia layered on top of Chinese domestic pricing [S3].
Procurement Resource's regional table for August 2026 confirms the same hierarchy: in-warehouse U.S. and German prices sit near $6,348–$6,361 per kg, while FOB China and CIF India sit at $3,518 per kg, a roughly 80% landed-vs-FOB spread that reflects the export-licence premium plus shipping, insurance, and buffer-stock costs for non-Chinese buyers [S4]. A practical comparison for procurement engineers: on a kilogram basis, August 2026 in-warehouse U.S. germanium was about 1.8x the FOB China price, versus a more typical 1.1–1.2x in years before the export-licence regime tightened [S3][S4].
Tariffs, stockpile policy, and U.S. policy levers
USGS lists the active U.S. tariff schedule for germanium: germanium dioxide at HTS 2825.60.0010 carries 3.7% ad valorem, other germanium oxides 3.7%, unspecified chlorides including germanium tetrachloride 3.7%, unwrought metal at HTS 8112.92.6000 2.6%, and metal powder and wrought forms 4.4%, with a 14% depletion allowance [S1]. These nominal rates are small relative to the price moves of the past 24 months, so the binding constraint on cost is the export-licence premium, not the customs duty.
On the stockpile side, USGS reports FY 2025 potential disposals of 5,000 kg (gross weight) of germanium from the National Defense Stockpile and shows FY 2026 potential acquisitions and disposals as NA, leaving the question of a domestic buffer open [S1]. The strategic parallel is hard to miss: the germanium squeeze resembles the EUV mask blank chokepoint described in coverage of AGC and Hoya's near-monopoly on substrate glass, where a single node of supply can halt an entire downstream industry, see how the pattern repeats across the EUV mask blank supply concentration story [S1].
Cost drivers and what a buyer can actually control
For procurement and process engineers, the 2026 germanium cost stack breaks into four layers, ranked by the size of the move they have produced since 2024: (1) the export-licence premium and ex-China scarcity, which S&P Global's 177 t gap and Procurement Resource's 80% in-warehouse-versus-FOB spread quantify; (2) freight, insurance, and in-warehouse carrying costs, visible in the FOB China to in-warehouse U.S. gap of roughly $2,800–$2,850 per kg in August 2026; (3) refining tolling and purity premium, where high-purity Ge for 5G and semiconductor doping is the fastest-growing slice at 8.7% CAGR; and (4) base duties of 2.6–4.4% and 14% depletion allowance, which are now the smallest line item in the cost stack [S1][S4][S5][S6].
The practical levers a buyer can pull are limited but real. First, qualify secondary and recycled sources: USGS confirms the U.S. has both preconsumer and postconsumer recovery capability, including IR-optics machining scrap, decommissioned military IR lenses, optical-fibre manufacturing waste, and end-of-life solar wafers [S1]. Second, lock multi-quarter supply contracts rather than buying spot, because the August 2026 in-warehouse U.S. price of $6,348.58 per kg is already well above the $1,991 per kg 2024 average and the market is forecast to remain firm under continued licensing [S1][S4]. Third, redesign where the application allows, substituting silicon for low-end thermal imaging and moving PET catalyst loads to antimony-based systems where product specifications permit, though neither substitution covers long-haul fibre core or high-efficiency space solar use [S3][S8]. For teams also sourcing switching power supply and construction machinery and equipment, the wider lesson is identical to other concentrated critical inputs: a single by-product node in the supply chain can swing a finished-goods cost line by multiples in 18 months.
Trackable next signals to watch: the USGS Mineral Commodity Summaries 2027 release in early 2027 for the official 2026 price average, any change to the FY 2026 U.S. National Defense Stockpile acquisition line currently marked NA, and the next quarterly update on Chinese export-licence volumes, which Procurement Resource shows dropped to near zero in April 2026 and partially recovered in May 2026 [S1][S4]. A second signal is the IEA's next Critical Minerals Outlook data point on ex-China refining capacity, since the 177 t S&P Global gap is closed only by new zinc-side by-product recovery, recycled feed, or stockpile release, none of which can move quickly [S6][S9].