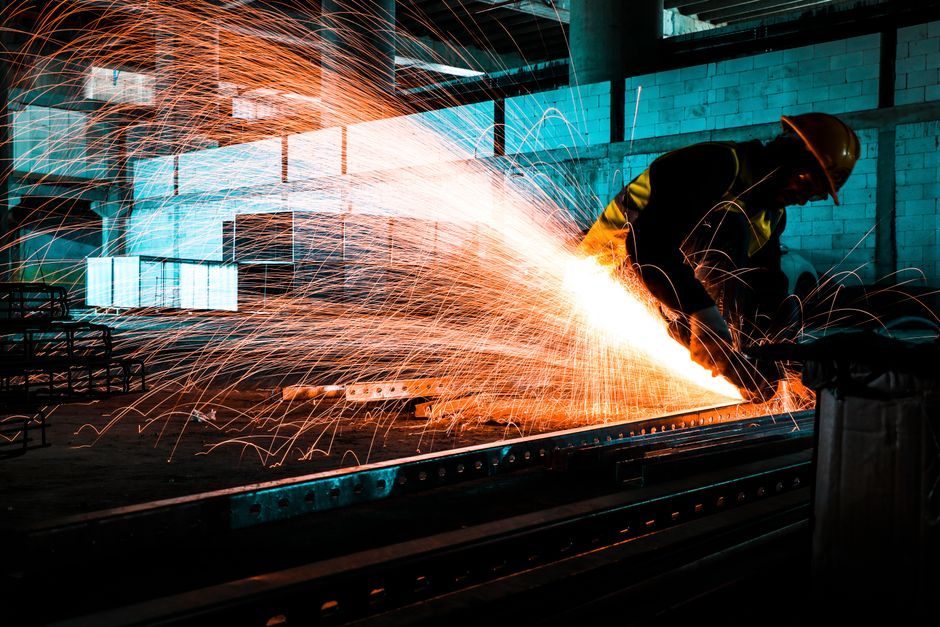
For a foundry-grade riser cutting machine, acquisition price covers only a minority share of the 10-year bill; energy and maintenance routinely dominate the lifecycle ledger when calculated dynamically per the Thiede/Spiering TCO framework [S1].
This analysis covers pneumatic, hydraulic, and all-electric riser cutting machine architectures, breaks down capital vs operating cost, ranks the four largest TCO drivers, and gives a 10-year cost-band model a process engineer can defend in front of procurement.
What TCO actually means for a riser cutting machine
TCO for a cutting machine used in a foundry riser-removal cell aggregates acquisition, installation, energy, consumables, preventive and corrective maintenance, downtime loss, and end-of-life disposal over the ownership horizon [S1]. The Thiede dynamic TCO method (originally validated on injection moulding but transferable to any discrete production machine) treats energy and maintenance as stochastic streams rather than static line items, because both are highly state-dependent and rise sharply with equipment age [S1].
Studies on industrial pumps and electric drive systems cited in the same framework confirm that use-phase costs, not purchase order value, are decisive for the lifecycle total [S1]. A riser cell is no exception: high-impact cyclic loading, abrasive dust from the cut face, and thermal shock on the blade seat punish any component not rated for foundry duty, and that punishment shows up as unplanned downtime, not as a purchase-order line item.
Cost-driver ranking and what moves each lever
Across foundry duty cycles, the four largest TCO drivers for a riser cutting machine rank, in descending order, as: (1) energy, (2) maintenance and spare parts, (3) unplanned downtime, and (4) acquisition amortized over the ownership window, with installation, tooling consumables, and end-of-life disposal trailing [S1]. German energy prices rose roughly 30% over the decade preceding the TCO framework paper, and that trajectory is the single largest sensitivity in any long-horizon TCO model [S1].
Specify a VFD on the spindle drive and IE4-class motors where grid code allows; both reduce kWh/cut without changing throughput. Driver 3 — Downtime: every hour of unplanned stop on a high-pressure coding machine or riser cell feeding a melt line costs multiples of the hourly machine depreciation; the economic case for stocking wear parts (blade seats, guide bushings, proximity switches) is therefore not "nice to have." Driver 4 — Acquisition: only decisive over a short horizon, which is exactly why TCO modelling exists.
Architecture comparison: pneumatic vs hydraulic vs all-electric
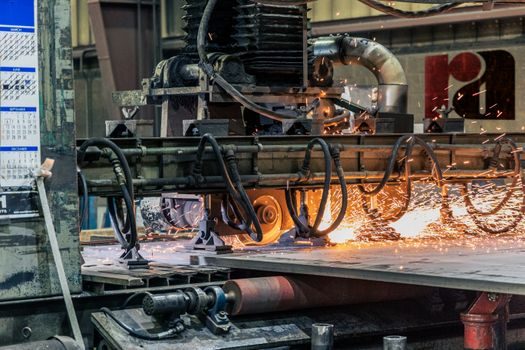
Architecture choice is the single biggest TCO lever, because it sets the energy curve, the maintenance curve, and the noise/dust footprint simultaneously. The table below ranks the three common riser cutting machine drive types against four TCO-relevant criteria. [S1]
Criterion 1 — Energy per cut: all-electric servo wins, hydraulic loses because the pump runs across the cycle. Criterion 2 — Maintenance cost share: pneumatic sits between the two, but air-treatment filters in a dusty foundry cell need monthly attention or downstream valve life collapses. Criterion 3 — Repeatability and cut quality: all-electric servo delivers the tightest position tolerance, which directly reduces over-cut scrap on the cast piece. Criterion 4 — Acquisition cost: pneumatic is the cheapest entry point, but its higher air consumption shifts cost into the compressor room, not into the cutting machine line item. For foundries already running an IE4 motor inventory on conveyors and core machine cells, the all-electric riser cutter drops onto the same spares shelf and the same electrician skill set, which is a real TCO advantage procurement rarely prices in.
10-year cost-band model a process engineer can defend
A defensible 10-year TCO band for a mid-size foundry riser cutting machine, expressed as a percentage of acquisition, runs roughly 100% acquisition for energy, 25-40% acquisition for cumulative maintenance, 15-30% acquisition for downtime loss, and 5-10% acquisition for installation plus disposal [S1]. Because the underlying energy and maintenance streams are dynamic, the band is wide on purpose; static accounting compresses the variance and biases the decision toward cheap acquisition [S1].
To stress-test the band, vary the energy price assumption ±30% (the historical German decade move) and the maintenance frequency assumption ±50%; the lifecycle total moves more from those two levers than from a 10% acquisition discount [S1]. That is the operational meaning of the Thiede dynamic TCO argument: decisions made on acquisition price alone systematically under-cost the ownership period. For a foundry running a 24/7 melt schedule, downtime cost should be priced at the marginal contribution of the parts the cell feeds, not at a generic "shop rate," or the model will understate the value of redundancy.
Spec and standard gates that change the TCO math

Three specification gates reliably move the TCO number: ISO 9001:2015-certified consumables and wear parts, documented mean-time-between-failure (MTBF) figures from the OEM, and a stated energy-per-cut figure measured at the machine terminal, not at the nameplate [S3]. Component Solutions Group, a Bufab company and ISO 9001:2015-certified fastener and C-Parts supplier, illustrates the wider industrial pattern: OEM-grade consumables and vendor-managed inventory reduce the hidden carrying cost of the spare-parts shelf that supports any cutting machine cell [S3].
Gate 1 — ISO 9001:2015 on the consumable supply chain: cuts the variance in blade life and the variance in delivery time on replacement parts, both of which feed the maintenance and downtime lines [S3]. Gate 2 — OEM-supplied MTBF and MTTR figures in writing: without them, the maintenance cost line is a guess, and the TCO model is a guess on top of a guess. Gate 3 — Measured kWh/cut at the machine terminal: a nameplate kW figure is not a duty-cycle figure, and the difference is what makes a hydraulic look cheaper than it is. For buyers comparing architectures, ask for the same figure on every shortlisted machine, or the comparison is not valid.
What TCO analysis will not fix
TCO modelling does not rescue a misapplied machine. A riser cutting machine specified below the required cut force will fail regardless of how clean its energy and maintenance curves are, and a cell designed without adequate dust extraction will burn through guide bushings on a schedule no maintenance budget can absorb [S1]. Buy the right machine first, then run the TCO on it; running TCO on the wrong machine just produces a precise number for a wrong decision.
The next trackable signals to watch in this category are foundry-specific IE4 + servo retrofit case studies, published kWh/cut benchmarks for riser cells, and MTBF/MTTR disclosures from the OEM. For adjacent spec work, see this explosion-proof lighting TCO band reference and this IE4 high-efficiency motor decision map, both of which use the same driver-ranking logic and can be combined with the riser-cell model in a single foundry TCO file.