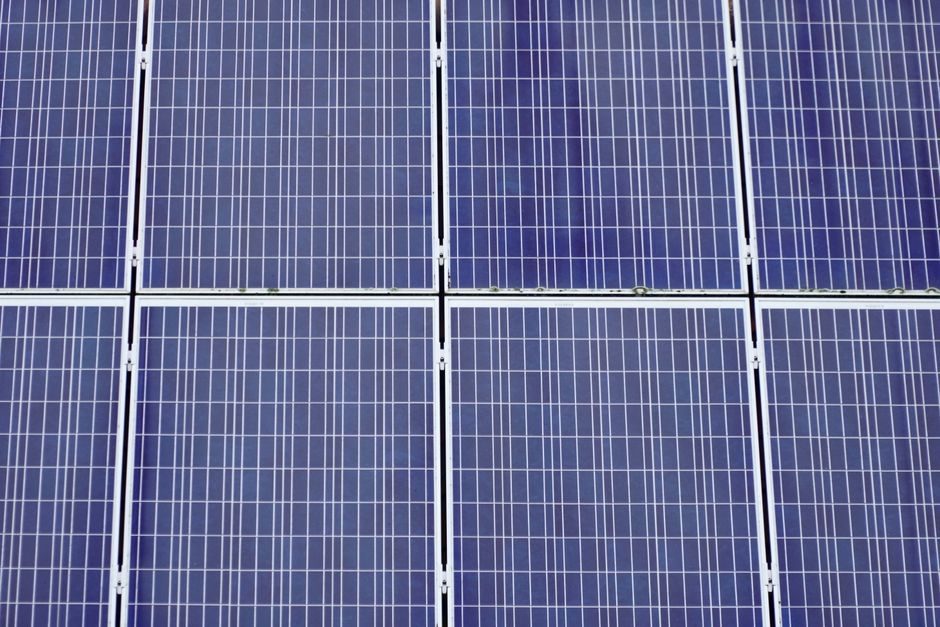
A turnkey c-Si module BOM in 2026 lands in the $0.10-$0.30/W cell-to-module range, with polysilicon + wafer + cell typically absorbing 50-65% of that cost depending on mono/poly and TOPCon vs PERC process choice [S4]. The remaining 35-50% sits in glass, EVA/POE encapsulant, aluminum frame, backsheet, junction box and string-tabber/laminator conversion overhead [S2][S9].
Equipment builders quote complete 240 MW to 1 GW annual panel assembly lines with turnkey CAD layout and 3D simulation, covering tabber-stringer, bussing, layup, EL tester, laminator, framing and junction welding [S1]. Indian module makers are meanwhile expanding cell capacity to 4.5 GW paired with 18,000 MTA of in-house aluminum extrusion for the frame, compressing the aluminum BOM line by vertical integration [S7].
The Five Cost Drivers in a Crystalline Module
Polysilicon, silicon wafer, solar cell, encapsulant glass, and aluminum frame together account for roughly 80-90% of a standard c-Si module's bill of materials in 2026; backsheet, junction box, ribbons, solder and EVA/POE fill the residual [S2][S4]. Polysilicon alone swung from a 2010 peak above $400/kg to a 2020 trough near $6.50/kg, spiked to roughly $40/kg in 2022, and stabilised around $8/kg in late 2023 — a 50x range that has historically decided whether a wafer/ingot line makes money [S4].
Silicon solar cell cost averaged $0.10-$0.15/W in 2023, with monocrystalline at about $0.12/W and polycrystalline marginally lower, anchored by that polysilicon feed-in price [S4]. Module assembly equipment on the 166/182/210 half-cut to 800 W shingled 1/3 or 1/8 cell formats adds conversion cost, not raw-material cost, and is quoted per MW of nameplate line capacity rather than per watt of output [S1].
Typical BOM Share and Per-Watt Range
A standard 144-half-cut monocrystalline PERC or TOPCon module breaks out roughly as follows in 2026: silicon wafer 18-24%, cell processing 15-22%, tempered glass 8-12%, EVA/POE encapsulant 6-10%, aluminum frame 5-9%, backsheet 3-5%, junction box + ribbons + solder 3-5%, with labour and depreciation filling the remainder [S2]. These are widely cited component ranges across China supplier datasheets, with silicon + cell combined crossing the 50% line on PERC and climbing toward 60% on TOPCon because of the extra n-type doping and tunneling oxide steps [S2][S4].
In the US installed market, a single 400 W class panel runs about $1,200 professionally installed, so a 20-30 panel system (8-12 kW DC) lands in the $24,000-$36,000 band per a 2025 survey of 1,000 customers [S5]. Hardware is roughly 30-40% of that installed number; the rest is racking, inverter, electrical BOS, permitting, and labour — which is why cell-to-module cost and rooftop-installed cost are two different cost stacks and should not be conflated [S5].
Who This Stack Is For (and Not For)
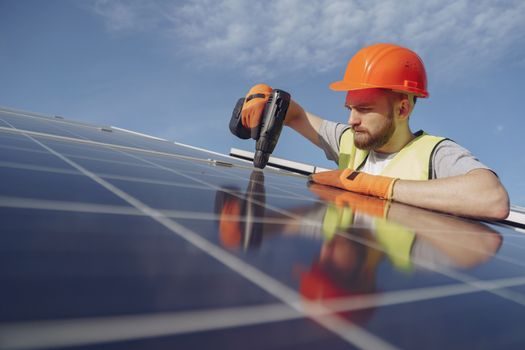
A 240-600 MW/yr fully automatic assembly line, with cell tabber stringer, bussing, layup, EL tester, laminator, framing machine and junction welding, targets tier-1 and tier-2 vertically integrated module makers running 166/182/210 half-cut or 1/3-cut shingled formats up to 800 W panels [S1]. A 5-10 MW semi-automatic line is the right fit for a regional assembler buying cells wholesale, contract manufacturing for rooftop brands, or a startup running 250-310 W poly modules [S1][S2].
For those, the Solar Panel Process Control instrument stack and the IEC, UL factory audit map read very differently from c-Si wafer-to-module lines. Procurement teams sourcing OEM/ODM assemblies should also read the EV OEM vs ODM spec map for the contract-manufacturing trade-offs, because the same ODM mechanics apply to module white-labelling.
Process Choice: PERC vs TOPCon vs Shingled
Process choice moves the cost stack more than line speed does. PERC remains the cheapest route at roughly $0.10-$0.13/W cell cost on mono wafers; TOPCon adds an n-type tunnel oxide and rear passivation that pushes cell cost 15-25% higher but lifts bifacial gain and temperature coefficient, which Indian and US tier-1 makers (Waaree, Emmvee, INA Solar) have publicly announced as their 2025-2026 expansion target [S7][S8].
For buyers, the selection logic is straightforward: choose PERC when $/W is the only metric and the site has good albedo; choose TOPCon when LCOE matters more than sticker price, and when 30-year degradation warranties and bifaciality are bankable; choose shingled when rooftop area is constrained and aesthetics matter. Each option shifts BOM weight from cell to module-level integration cost, and each shifts the relevant encyclopedia reference — for example, the cell-to-module lamination loop on the HMI panel controls and the framing on the aluminum veneer panel extrusion lines, both of which have direct process analogues in module assembly.
Capex vs Opex: The Line-Size Trade-Off
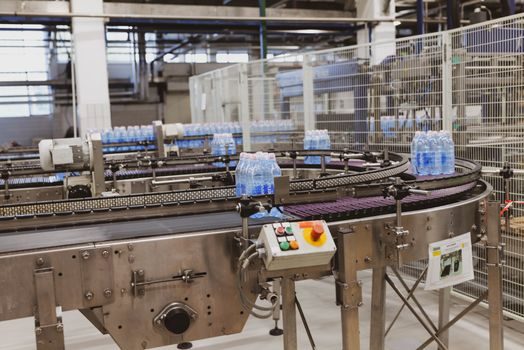
Capex per MW of nameplate panel-assembly capacity scales nonlinearly: 5-10 MW semi-automatic lines sit at the high end of $/MW because fixed automation cost is amortised over small volume, while 240-300 MW and 500 MW-1 GW full-auto lines compress $/MW by spreading tabber-stringer, layup, EL tester, and laminator capex across more panels [S1].
This is why vertically integrated players pair 4.5 GW cell lines with 18,000 MTA of in-house aluminum extrusion — the cell and frame cost lines are the two largest wafer-adjacent BOM items, and in-house control stabilises both [S7]. ODM/OEM contract assemblers, by contrast, accept the higher $/W conversion cost in exchange for not tying up capex, a trade-off laid out in the arc welding machine TCO stack for adjacent joining processes.
Total Cost of Ownership: Not Just the Panel Sticker
Total cost of ownership for a solar panel runs well beyond the cell-to-module BOM.
Energy and consumables cost is small relative to capex for PV — a c-Si line draws meaningful power at the diffusion, PECVD and laminator stages, but the BOM is dominated by materials, not kWh [S2][S9]. Maintenance cost centres on the tabber-stringer (copper ribbon wear), the laminator (silicone vacuum bag and PTFE blanket replacement every 3-5 years), and the framing machine (aluminum saw blade and mitre tooling), so spares inventory on these three sub-assemblies is the single most predictable TCO lever for any 240 MW+ line [S1].
Limitations, Failure Modes and Spec Traps
Capacity numbers also need to be read carefully: a "500 MW-1 GW" line nameplate is module output, not cell output, and 1 GW of modules only requires roughly 1.2 GW of cell input once you account for cell-to-module yield loss of 1-3% on a healthy line [S1].
The two most common spec traps in 2026 are (1) confusing the 2023 cell cost range of $0.10-$0.15/W with 2026 module cost, where TOPCon process premiums and silver-aluminium paste prices have shifted the band, and (2) treating the $8/kg late-2023 polysilicon price as a current input cost without confirming the wafer contract index [S4]. A reliable next step is to track the polysilicon spot price, the silver paste price, and the EVA/POE encapsulant film price, then re-anchor the silicon + cell line of the BOM before locking a procurement decision. Related process-control reading on the additive manufacturing material and lightweight partition panel pages shows how composite BOM stacks behave under similar scaling and certification pressure.